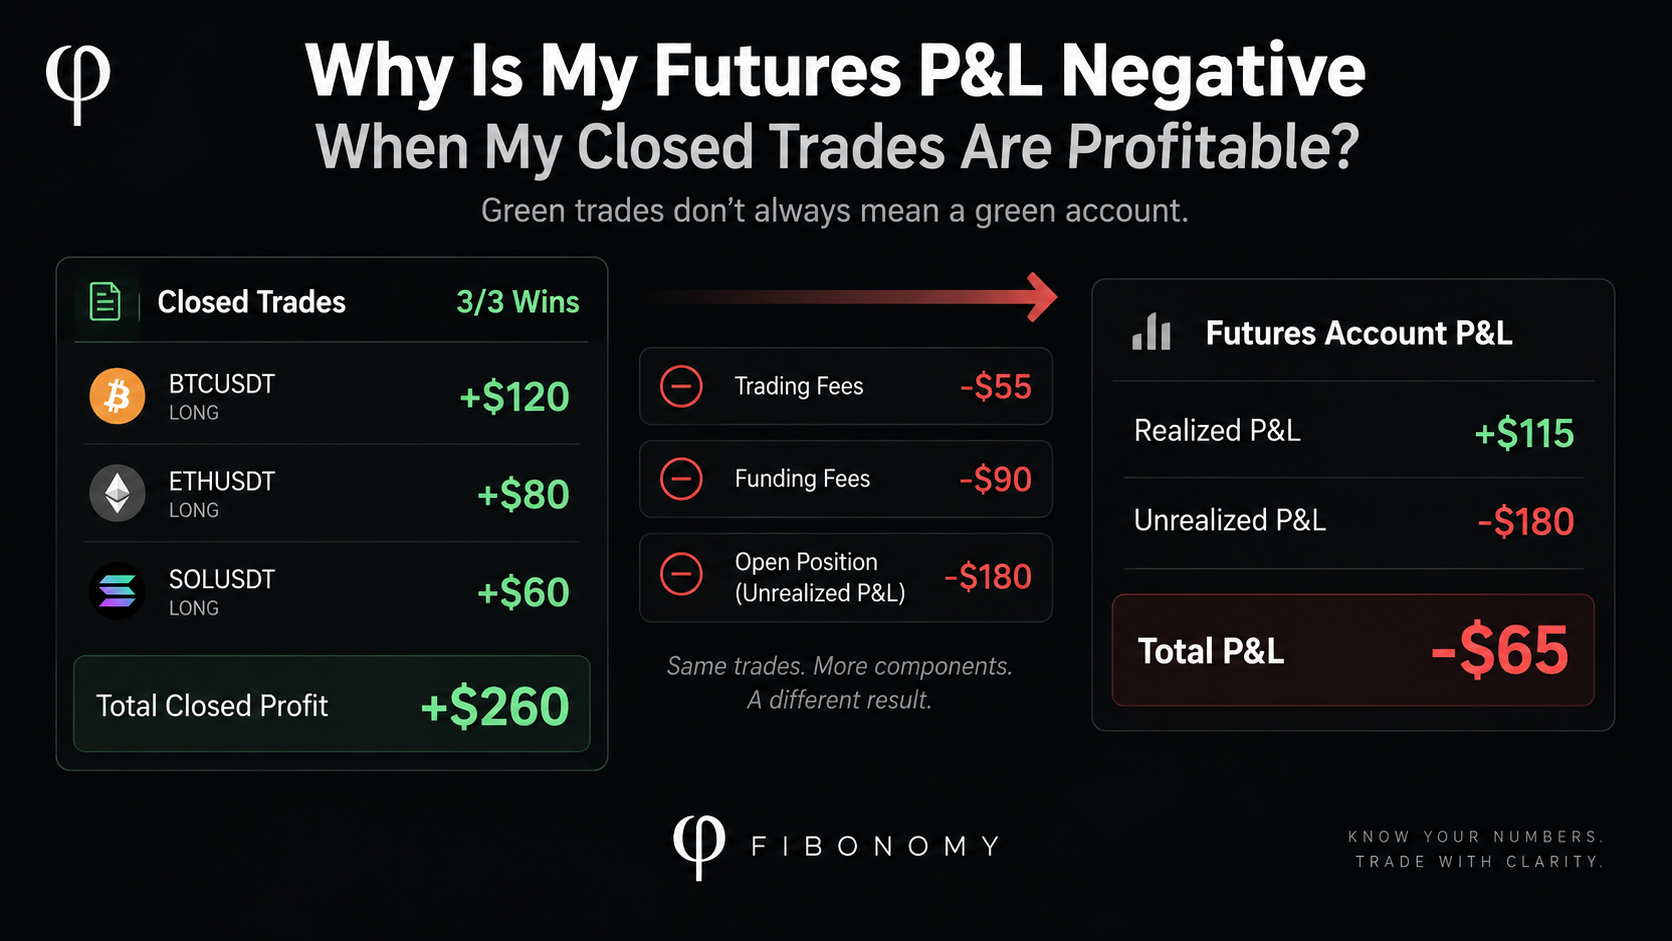
Futures P&L negative while your closed trades are profitable? That does not necessarily mean one of the numbers is wrong.
You open your futures history.
Your closed trades look profitable.
BTCUSDT    +$120

ETHUSDT     +$80

SOLUSDT     +$60
Total:
+$260
But somewhere else in the exchange, your Futures P&L says:
-$65
How can both be true?
Because a profitable trade and a profitable account are not always the same calculation.
Different screens can be showing different parts of the story:
Price P&L

Trading Fees

Funding Fees

Realized P&L

Unrealized P&L

Open Positions

Partial Closes
And different exchanges do not always use the words Closed P&L, Realized P&L, Position P&L, and Total P&L in exactly the same way.
So when your futures P&L is negative, the first question should not be:
“Which number is wrong?”
Ask:
“What does each number actually include?”
Quick Answer
Your closed trades can appear profitable while your overall futures result is negative because the number you are comparing may not include the same components.
For example:
Gross Closed-Trade Profit
+$260
Then:
Trading Fees
-$55
and:
Funding Paid
-$90
Your realized net result becomes:
$260
-
$55
-
$90

=

+$115
Still profitable.
But suppose you also have an open position showing:
Unrealized P&L
-$180
Now:
Realized Net      +$115

Unrealized P&L    -$180
────────────────────────

Current Combined Result
-$65
Every number can be correct.
They are simply answering different questions.
Table of Contents
Futures P&L Negative? First Check What “P&L” Includes
A futures interface may show several numbers that look similar.
But they are not interchangeable.
Conceptually, separate these:
POSITION P&L

CLOSED P&L

REALIZED P&L

UNREALIZED P&L

ACCOUNT / TOTAL P&L
The exact labels and formulas vary by exchange.
That is the first thing to understand.
Position P&L: Did Price Move in Your Favor?
At its simplest, position P&L measures what happened between entry and exit—or between entry and the current market price.
Suppose:
BTCUSDT LONG

Entry:
$60,000

Exit:
$61,000

Size:
0.10 BTC
Gross price P&L:
($61,000 - $60,000)
×
0.10 BTC

=

+$100
From the price movement alone:
Trade Profit
+$100
That does not necessarily mean:
Net Profit
+$100
because the trade may also have generated costs.
That distinction is where many P&L mismatches begin.
Trading Fees Reduce a Winning Trade
Opening a futures position can generate a trading fee.
Closing it can generate another.
Binance Futures currently describes commission fees as being incurred when orders execute, with fees based on notional value and the applicable fee rate.
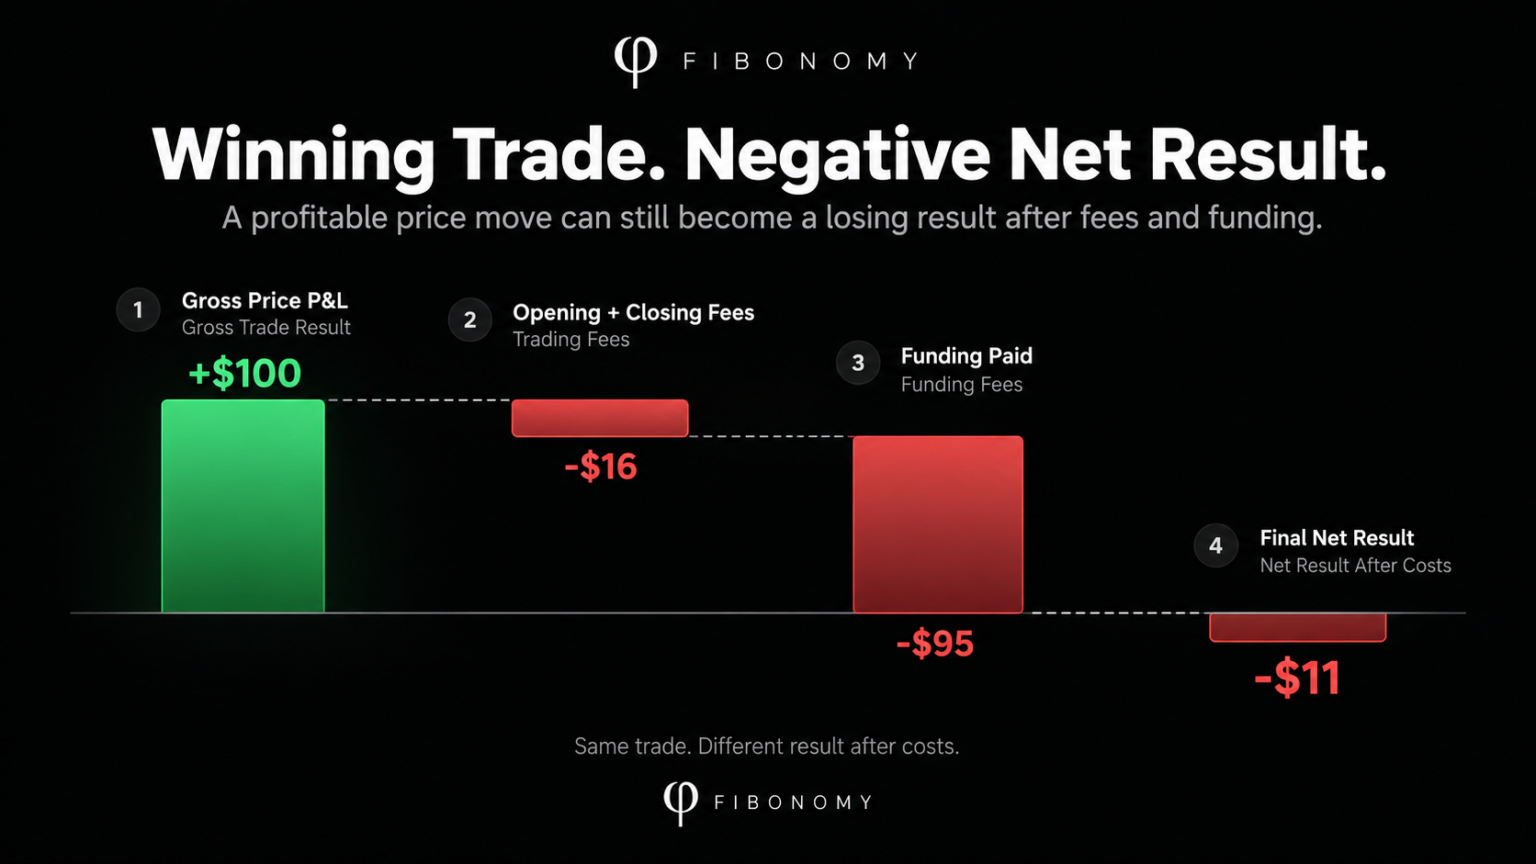
Suppose your price P&L is:
+$100
But you paid:
Opening Fee
-$8

Closing Fee
-$8
Net result before funding:
+$100
-$8
-$8

=

+$84
The trade was correct directionally.
The account made less than the raw price movement suggests.
This distinction becomes more important for:
- large position sizes,
- frequent trading,
- market-order-heavy execution,
- short holding periods,
- thin edges.
A small gross winner can become a small net loser.
Funding Can Turn a Winner Into a Loser
Now suppose the position stayed open through several funding settlements.
Gross trading P&L:
+$100
Trading fees:
-$16
Funding paid:
-$95
Now:
+$100
-
$16
-
$95

=

-$11
The trade’s price movement was profitable.
The final economic result was negative.
Bybit’s current USDT perpetual documentation makes this distinction explicit:
Closed P&L
=
Position P&L
-
Opening Fee
-
Closing Fee
-
Funding Fees
Funding and trading fees are included in Closed P&L even though they are not included in the basic unrealized P&L calculation.
CoinEx similarly includes trading P&L, trading fees and funding fees in Realized PNL.
We looked at the funding mechanism separately in:
Can Funding Fees Move Your Liquidation Price?
The same funding event that changes margin conditions can also change your final realized result.
Unrealized P&L Can Make the Account Red While Closed Trades Are Green
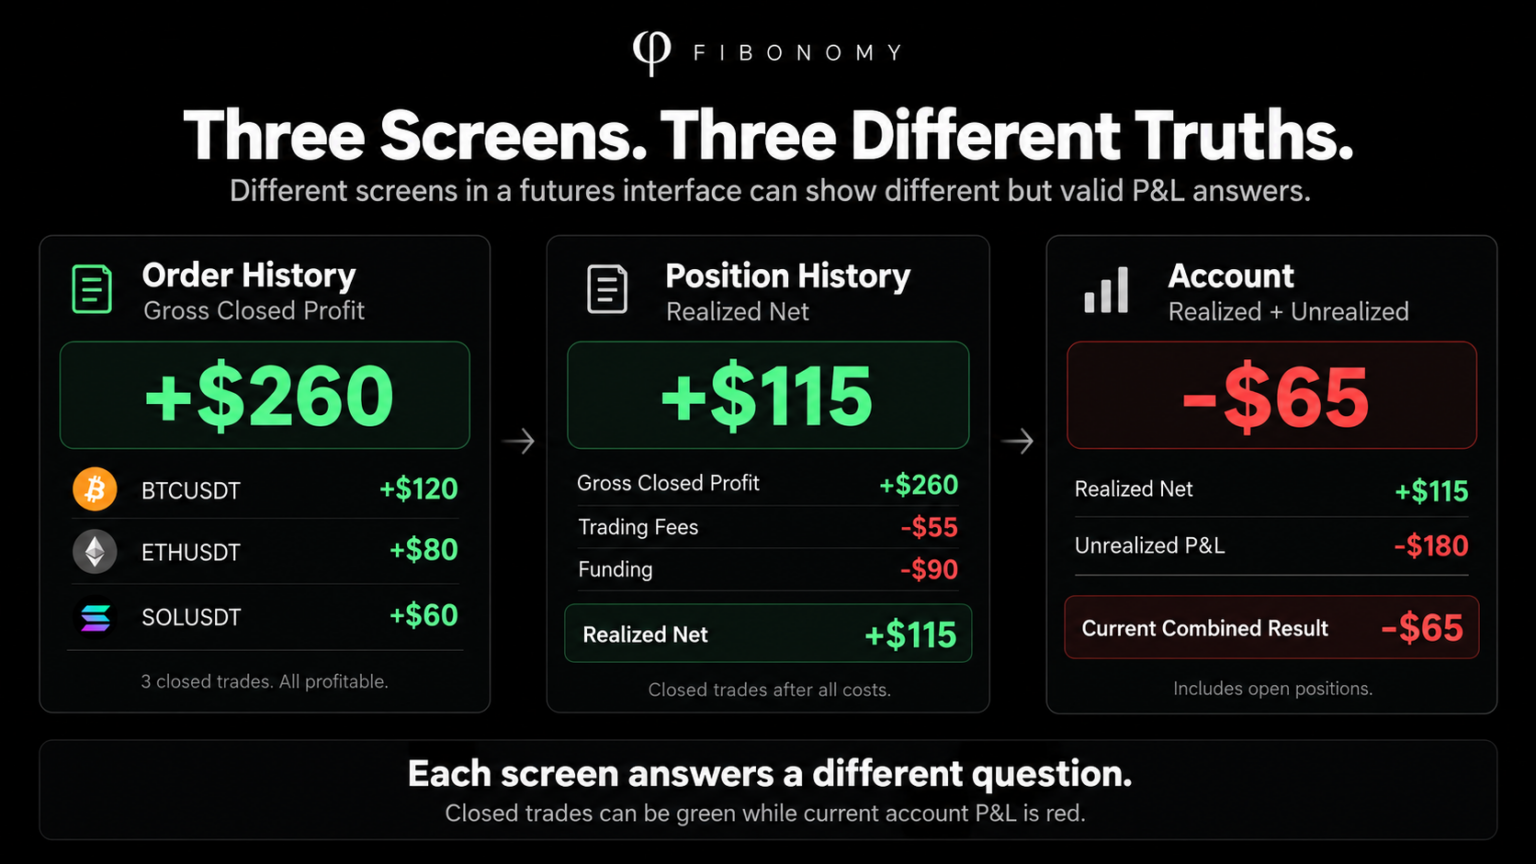
Now imagine you have already closed three winning trades:
BTCUSDT    +$120

ETHUSDT     +$80

SOLUSDT     +$60
Gross closed profit:
+$260
After fees and funding:
Realized Net
+$115
But another position is still open:
DOGEUSDT LONG

Unrealized P&L:
-$180
Your closed-trade history can remain green:
+$115 realized
while the current mark-to-market account picture becomes:
+$115
-
$180

=

-$65
Binance distinguishes realized P&L from unrealized P&L and notes that unrealized futures losses can affect margin balance while positions remain open.
CoinEx similarly defines total PNL as:
Total PNL
=
Realized PNL
+
Unrealized PNL
and account equity as account balance plus unrealized PNL.
So this situation is completely possible:
CLOSED TRADES
GREEN

ACCOUNT RIGHT NOW
RED
Nothing is necessarily broken.
You are comparing history with current state.
Order History and Position History May Not Show the Same Profit
This one causes a lot of confusion because the exchange itself can show two different profit numbers.
OKX documents a very clear example.
Its Order History may show:
Closed Profit
+$0.46
But the Position History includes:
Closed Profit       +$0.46

Opening Fee         -$0.03

Closing Fee         -$0.03

Funding              $0.00
───────────────────────────

Realized P&L        +$0.40
Both screens describe the same trading activity.
They simply include different components.
This gives us an important rule:
Never compare two P&L numbers before checking whether they use the same definition.
Closed P&L and Realized P&L May Also Be Different
Even inside a single exchange, two similar labels can represent different states.
Bybit distinguishes Closed P&L from Realized P&L.
Realized P&L can accumulate while a position is still open because of:
- partial closes,
- trading fees,
- funding fees.
Closed P&L is recorded when the position is finally closed.
For partial closes, Bybit prorates relevant fees when calculating Closed P&L.
So a position can still exist while some of its P&L has already become realized.
Conceptually:
ORIGINAL POSITION

1.00 BTC
You close:
0.40 BTC
Now:
0.40 BTC
→ Realized Trading P&L

0.60 BTC
→ Still Open
→ Unrealized P&L
One original position now contains both:
REALIZED HISTORY

+

UNREALIZED EXPOSURE
A single green or red number cannot explain that whole lifecycle.
Partial Closes Can Break the “One Entry, One Exit” Mental Model
Many traders mentally reconstruct a trade as:
ENTRY

↓

EXIT

↓

P&L
Real futures positions often look more like:
OPEN 0.50 BTC

↓

ADD 0.25 BTC

↓

CLOSE 0.20 BTC

↓

ADD 0.10 BTC

↓

CLOSE 0.30 BTC

↓

FUNDING

↓

CLOSE REMAINDER
Now ask:
“What was the profit on this trade?”
There is no longer one simple entry and one simple exit.
You have:
- multiple fills,
- changing average entry,
- partial realized P&L,
- remaining unrealized P&L,
- opening fees,
- closing fees,
- funding events.
This is why the position lifecycle matters more than a single order row.
We covered how the position itself changes when size is increased in:
What Happens to Liquidation Risk When You Add to a Futures Position?
The same additions that change size and average entry also make later P&L reconstruction more complex.
Average Entry Price Can Make the History Look Cleaner Than It Really Was
Suppose:
Buy 0.10 BTC @ $60,000

Buy 0.10 BTC @ $58,000
The exchange may now show:
Position Size
0.20 BTC

Average Entry
$59,000
That is useful.
But it compresses two separate decisions into one number.
Now suppose you partially close:
0.10 BTC @ $59,500
A trader looking only at:
Average Entry:
$59,000

Exit:
$59,500
may conclude:
Profitable trade
But that is not enough to reconstruct everything that happened before and after the partial close.
Fees.
Funding.
Previous realized portions.
Remaining position.
All still matter.
The average entry is a useful state variable.
It is not the entire history.
A Positive ROI Does Not Guarantee Positive Final P&L
This connects directly to leverage.
Suppose an open position shows:
ROI
+25%
That does not automatically mean:
Final Net Result
+25%
ROI can use margin as its denominator.
The displayed percentage may change when leverage or margin changes even when dollar P&L does not.
We covered this directly in:
Why Changing Leverage Doesn’t Always Change Risk the Way You Expect
So when reconstructing a futures result, distinguish:
ROI %

from

P&L in USD

from

Net Realized P&L
Three different numbers.
Three different questions.
Slippage Can Reduce the Profit You Thought You Closed
Suppose you plan to close:
BTCUSDT LONG

Expected Exit:
$61,000
Your expected gross profit is:
+$100
But the order actually fills around:
$60,850
Now the actual trading P&L is lower.
The price on the chart or the stop/take-profit trigger is not necessarily the final execution price.
The final P&L must use what actually executed.
That is why execution history matters.
We covered the difference between trigger and execution in:
Why You Can Be Liquidated With a Stop Loss
The same execution principle applies even when the outcome is profitable.
A Worked Example: Every Closed Trade Is Green, but the Account Is Red
Let’s reconstruct one account.
Starting balance:
$10,000
Closed Trade 1
BTCUSDT:
Gross Price P&L:
+$120
Closed Trade 2
ETHUSDT:
Gross Price P&L:
+$80
Closed Trade 3
SOLUSDT:
Gross Price P&L:
+$60
The trade list looks perfect:
3 Winners

0 Losers

Gross Closed Profit:
+$260
Now include trading fees:
Opening + Closing Fees

-$55
Result:
+$205
Then funding paid:
-$90
Realized net:
+$115
Still profitable.
But one position remains open:
DOGEUSDT LONG

Unrealized P&L:
-$180
Current combined result:
Realized Net        +$115

Open P&L            -$180
─────────────────────────

Current Result       -$65
So all four statements can be simultaneously true:
Win Rate:
100%

Gross Closed P&L:
+$260

Realized Net P&L:
+$115

Current Combined P&L:
-$65
There is no contradiction.
Each metric answers a different question.
Win Rate Can Be Positive While Net P&L Is Negative
This example exposes another dangerous assumption:
More winning trades
=
More money
Not necessarily.
Suppose:
9 winners × +$20
=
+$180
and:
1 loser
=
-$250
Before fees:
Net P&L
-$70
Win rate:
90%
Account result:
Negative
Now add:
Trading Fees
Funding
Slippage
and the gap becomes larger.
This is why:
WIN RATE
is not:
PROFITABILITY
A trade history can visually look successful while the account economics say otherwise.
Funding Can Accumulate Across a Long-Held Position
Consider a position that stays open for several days.
Price eventually moves enough to produce:
Gross Price Profit
+$300
But during the holding period you paid:
Funding 1     -$22

Funding 2     -$25

Funding 3     -$18

Funding 4     -$30

Funding 5     -$21
Total funding:
-$116
Trading fees:
-$34
Final net:
+$300
-
$116
-
$34

=

+$150
The price move tells only half the story.
And if gross profit had been:
+$120
the same costs would produce:
+$120
-
$116
-
$34

=

-$30
A winning price move.
A losing economic outcome.
Binance currently identifies commission fees and funding fees as separate costs generated in Futures trading.
Exchange Definitions Matter
There is no safe assumption that every field called “P&L” means exactly the same thing.
Binance Futures
Binance distinguishes realized and unrealized P&L, while Futures trading can generate both commission and funding fees. Its current P&L material also notes that fees reduce net P&L.
Bybit
Bybit’s Closed P&L explicitly includes:
Position P&L
-
Opening Fee
-
Closing Fee
-
Funding
while unrealized P&L excludes those costs.
OKX
OKX explicitly distinguishes Order History from Position History.
For futures, Position History realized P&L includes:
Closed Profit

+

Funding Fees

+

Trading Fees
while Order History can show the closed profit separately.
Its API definition is similarly explicit:
realizedPnl
=
pnl
+
fee
+
fundingFee
+
liqPenalty
+
settledPnl
for applicable futures products.
CoinEx
CoinEx defines Realized PNL as including:
Trading PNL from reduction / closure

+

Trading Fees

+

Funding Fees
and defines Total PNL as realized plus unrealized PNL.
The Same Label Is Not Enough
Imagine two exchanges both display:
Realized P&L
You should not immediately assume:
Exchange A formula
=
Exchange B formula
Before comparing them, determine:
Does it include opening fees?

Does it include closing fees?

Does it include funding?

Does it include partial closes?

Does it include settlements?

Does it include liquidation penalties?

What price basis is used?

What time period does it cover?
That is the actual definition of the number.
How to Reconstruct Why Your Futures P&L Is Negative
If your trades look profitable but your account does not, reconstruct it in this order.
1. Start With Executed Closing P&L
Not the expected exit.
Not the trigger price.
Use actual fills.
Gross Trading P&L
2. Add Every Trading Fee
Include:
Opening Fees

+

Closing Fees

+

Fees from Partial Closes

+

Fees from Adds
3. Add Funding History
For the entire position lifecycle:
Funding Received
-
Funding Paid
Do not inspect only the most recent funding event.
4. Reconstruct Partial Realizations
Identify every:
Reduce

Partial Close

Scale Out
because some P&L may already have been realized before the final position disappeared.
5. Separate Open From Closed P&L
Calculate:
Realized Net
separately from:
Unrealized P&L
Then combine them only if you are intentionally asking for the current total trading result.
6. Check the Exchange’s Definition
Ask:
What does THIS field include?
not:
What does “P&L” usually mean?
7. Reconcile Back to Account Balance
Finally:
Starting Account State

+

Realized Trading Results

+

Funding

-

Fees

±
Transfers / Other Account Events

+

Current Unrealized P&L

↓

Current Account State
The exact balance equation depends on the exchange and account structure, but every unexplained difference should have an event behind it.
The Better Question
Do not ask:
“Why does my P&L not match?”
That is too broad.
Ask:
“Which events exist between the profit shown on my closed trades and the change that actually happened to my account?”
Then reconstruct:
Closing Fills

      ↓

Gross Trading P&L

      ↓

Trading Fees

      ↓

Funding

      ↓

Partial Realizations

      ↓

Remaining Open P&L

      ↓

Account Impact
Now the mismatch becomes explainable.
The Bottom Line
Your futures trade history can look profitable while your account is losing money.
That can happen because the green number you are looking at may represent only one component of the position.
A complete futures result may include:
Trading P&L

-

Trading Fees

±
Funding

±
Partial Realized P&L

+
Unrealized P&L from Open Positions
And exchanges may present those components on different screens under different labels.
So when your futures P&L is negative, do not immediately assume the exchange calculated something incorrectly.
First determine:
“Which P&L am I looking at, what does it include, and what happened between the trade and the account?”
A green trade row is evidence.
It is not yet the whole truth.
See Where the Difference Came From
Fibonomy reconstructs the events behind your positions—fills, size changes, funding, fees, realized results, and remaining account impact—so you can see why the number on one screen does not always match the result of the account.
See My Positions →
Not a signal. Futures P&L fields and accounting rules vary by exchange, contract type, account mode, and interface.
Sources
Binance Futures — What Fees Are Generated in Futures Trading?
Commission fees, funding fees and the mechanics that can reduce the net result of a futures position.
Binance Academy — Profit and Loss (PnL)
Realized vs unrealized P&L and the effect of fees on net trading results.
Bybit — P&L Calculations for USDT Perpetual and Expiry Contracts
Closed P&L, Realized P&L, partial closes, trading fees and funding fees.
Bybit — FAQ: P&L Calculation
Why a profitable unrealized position can become a negative closed P&L after fees and funding.
OKX — Trading Fee Rules FAQ
Why Order History and Position History can show different profits and how trading and funding fees enter Realized P&L.
OKX — API Documentation
Current futures Realized P&L components, including P&L, fees, funding, liquidation penalties and settlement P&L.
CoinEx — Introduction to Futures PNL Analysis
Realized PNL, funding, trading fees and position-closing P&L.
CoinEx — Account Equity and PNL Calculation for USDⓈ-Margined Contracts
How Realized PNL, Unrealized PNL and futures account equity relate.