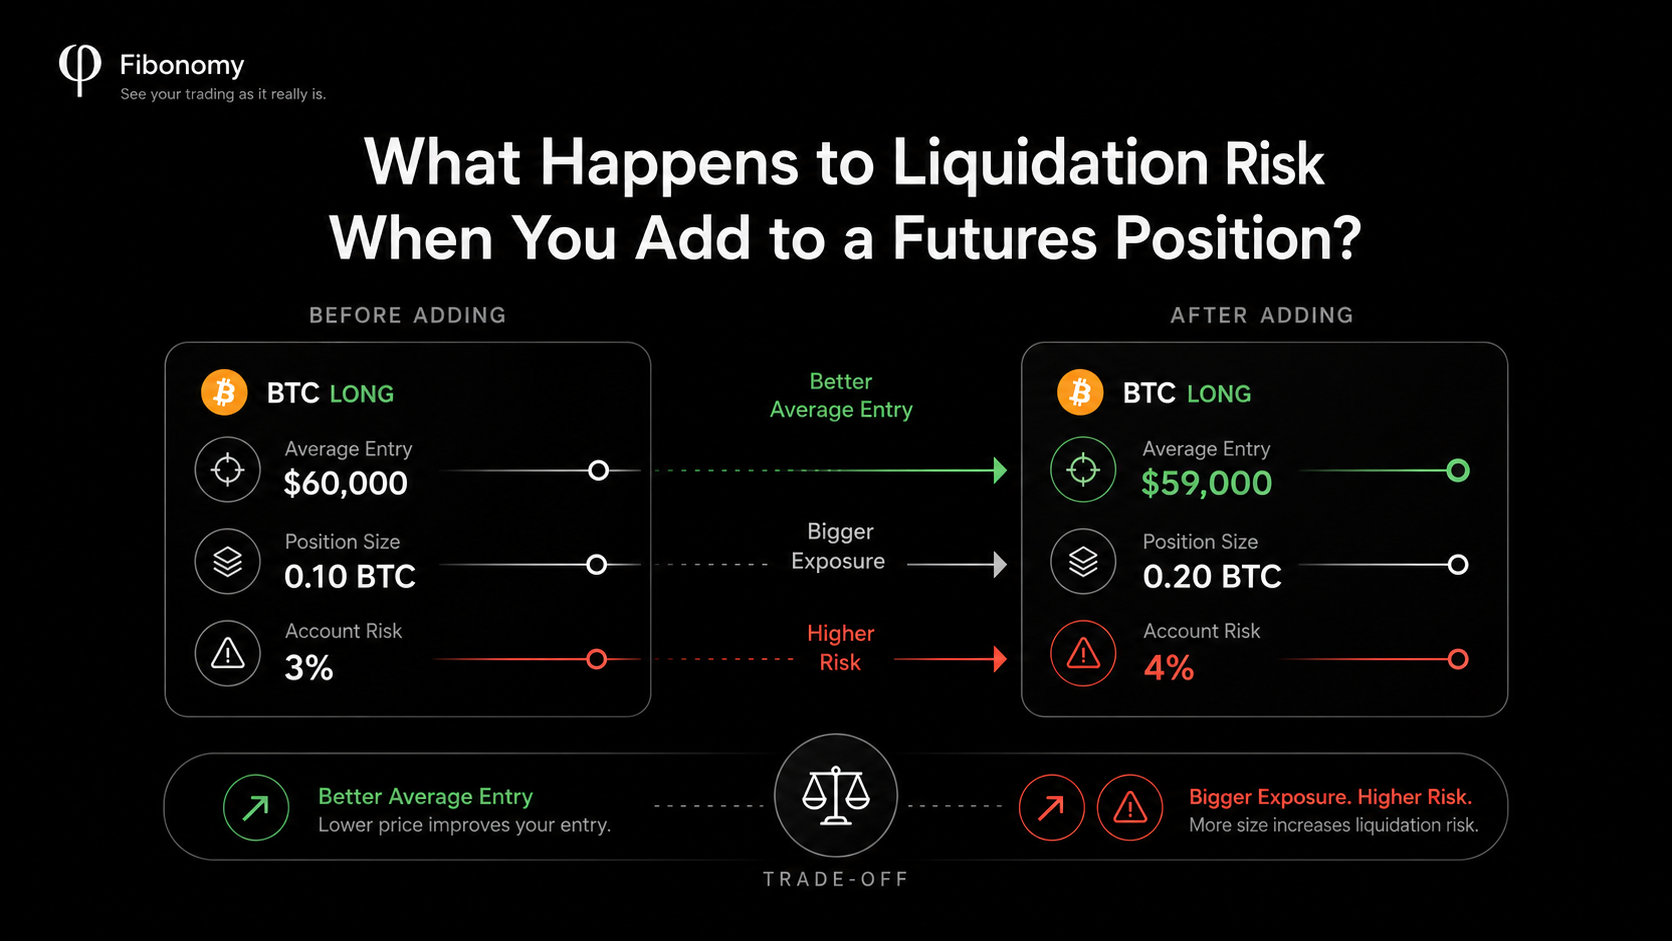
You are already LONG BTCUSDT.
Price moves against you.
Instead of closing the trade, you buy more.
Your average entry price improves.
The position looks better.
But is the trade actually safer?
Not necessarily.
When you add to a futures position, several things can change at the same time:
- your position size,
- your average entry price,
- your position value,
- your Maintenance Margin,
- your liquidation price,
- your potential loss,
- and, in Cross Margin, the risk carried by the entire account.
That creates a common trap:
A better average entry price can make the position look better while the account is carrying more risk.
To understand what actually changed, you have to look beyond the new entry price.
Quick Answer
When you add to a futures position, the exchange combines the new fill with your existing position.
For a same-direction position, this usually means:
Position Size ↑

Average Entry Price changes

Position Notional ↑

Maintenance Margin can ↑

Liquidation Price can change

Potential Account Loss can ↑
The key distinction is:
Better Entry Price
≠
Lower Risk
You may have improved the price at which the position breaks even while simultaneously increasing the amount of capital exposed to the next market move.
That is why the useful question is not:
“Did my average entry get better?”
It is:
“What happened to the amount of account capital exposed after I added?”
Table of Contents
What Does “Adding to a Position” Actually Mean?
Suppose you open:
BTCUSDT LONG

0.10 BTC

Entry:
$60,000
Your position value at entry is:
0.10 × $60,000

=

$6,000
BTC falls to:
$58,000
You buy another:
0.10 BTC
Now you no longer have two separate long positions.
In a standard one-way futures position, the exchange generally combines them into one larger position.
You now hold:
0.20 BTC LONG
and your average entry price changes.
Bybit’s current USDT perpetual documentation, for example, calculates Average Entry Price as total contract value divided by total quantity. Its documentation explicitly states that adding new orders to an existing position changes the Average Entry Price.
CoinEx likewise states that when positions are added, the position value and average entry cost are recalculated from the executed prices.
Your Average Entry Price Changes First
Using the example:
First entry:
0.10 BTC × $60,000

=
$6,000
Second entry:
0.10 BTC × $58,000

=
$5,800
Total:
Position Size:
0.20 BTC

Total Entry Value:
$11,800
New average entry:
$11,800
÷
0.20

=
$59,000
So:
Old Average Entry

$60,000


New Average Entry

$59,000
That looks better.
BTC now only needs to move from:
$58,000
→
$59,000
for the position to return approximately to its average entry price.
Before adding, it needed to recover to:
$60,000
This is why averaging down feels powerful.
But we have only looked at one number.
The Position Is Also Twice as Large
Before adding:
Position Size

0.10 BTC
After adding:
Position Size

0.20 BTC
That means the next $1,000 BTC move has a different effect.
Before:
0.10 BTC × $1,000

=
$100 P&L change
After:
0.20 BTC × $1,000

=
$200 P&L change
The average entry improved.
But the sensitivity of the account to the next move doubled.
Better Average Entry

+

Larger Exposure

=
Different Risk
This is the part a position row can hide if you focus only on Entry Price.
A Better Average Entry Can Still Mean More Capital at Risk
Now add a stop loss.
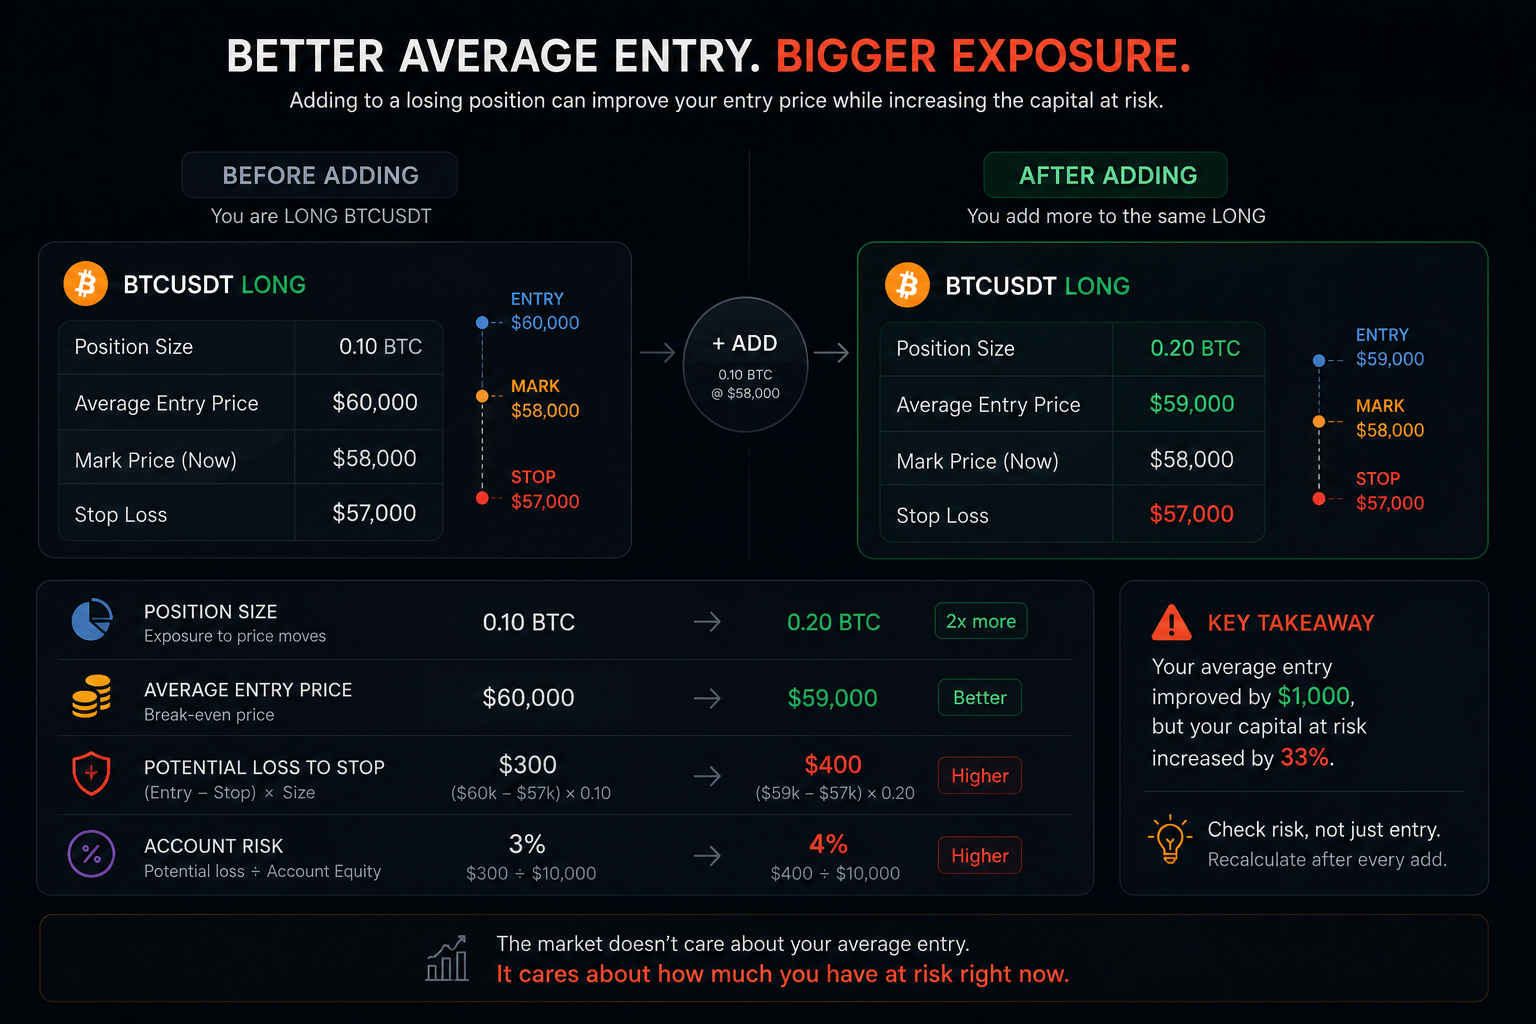
Before adding:
Account Equity:
$10,000

BTC Position:
0.10 BTC

Average Entry:
$60,000

Stop:
$57,000
Approximate potential loss to the stop:
($60,000 − $57,000)
×
0.10 BTC

=
$300
As a percentage of the account:
$300
÷
$10,000

=
3%
Now BTC falls to $58,000 and you add another 0.10 BTC.
New position:
Size:
0.20 BTC

Average Entry:
$59,000
Keep the same stop:
$57,000
Potential loss from the new average entry:
($59,000 − $57,000)
×
0.20 BTC

=
$400
Account risk:
$400
÷
$10,000

=
4%
Look at what happened:
AVERAGE ENTRY

$60,000
↓
$59,000

BETTER
but:
POTENTIAL LOSS

$300
↑
$400

WORSE
That is the important result.
The entry improved while the amount of account capital exposed increased.
This is why averaging down should never be evaluated from Average Entry Price alone.
Moving the Stop Can Increase Risk Even More
Now suppose after adding you also move your stop:
Old Stop:
$57,000

New Stop:
$56,000
New potential loss:
($59,000 − $56,000)
×
0.20

=
$600
Which is:
$600
÷
$10,000

=
6%
The trader may visually see:
Average Entry improved by $1,000
while the account reality became:
Capital at Risk

3%
→
6%
That is a completely different story.
This is why Fibonomy’s account-risk view should care about the current size + current protection level + account equity, rather than treating a lower average entry as automatically positive.
For the broader account calculation, see:
How Much of Your Account Is Actually at Risk Across Open Futures Positions?
Maintenance Margin Can Increase When You Size Up
Adding to a position also increases position value.
Suppose BTC is around:
$58,000
Before adding:
0.10 BTC
×
$58,000

=
$5,800 position value
After adding:
0.20 BTC
×
$58,000

=
$11,600 position value
Maintenance Margin is generally related to position value and the applicable Maintenance Margin Rate.
So even if the rate itself stays unchanged:
Position Value ↑

        ↓

Maintenance Margin ↑
But there is another layer.
Many futures exchanges use position tiers or notional brackets.
As the position gets larger, you may move into another risk tier.
OKX explicitly documents that larger positions can move into higher tiers with higher Maintenance Margin requirements and lower available maximum leverage.
Bybit also bases Maintenance Margin Rate on the applicable risk-limit tier, and its newer margin system dynamically considers real-time position and order values when determining those tiers.
Binance Futures similarly exposes notional and leverage brackets for USDⓈ-M Futures rather than treating every position size identically.
So adding to a position can sometimes produce:
Position Size ↑

+

Position Value ↑

+

Maintenance Margin Rate ↑
Not just:
More contracts
Adding to a Position Can Change the Liquidation Price
This is where many traders expect a simple rule:
“If I average down, my liquidation price should become safer.”
That is not universally true.
The new liquidation state depends on things such as:
- the new average entry price,
- total position size,
- margin mode,
- leverage,
- available margin,
- Maintenance Margin,
- risk tier,
- other positions,
- and account equity.
CoinEx makes this particularly explicit: its current documentation lists adding to a position as one of the events that causes liquidation price to be recalculated in both Cross and Isolated Margin.
Bybit’s formulas similarly include position size, average entry price, Initial Margin, Maintenance Margin and risk tier when calculating liquidation conditions.
So:
Added Lower
does not automatically mean:
Liquidation Risk Lower
The position has changed on several dimensions at once.
We covered why liquidation prices themselves can move here:
Why Does My Liquidation Price Keep Changing in Cross Margin?
And if other positions are open in the same Cross Margin account, see How Multiple Open Futures Positions Affect Your Liquidation Risk.
Cross Margin Makes the Change Account-Wide
In Isolated Margin, the position is largely supported by the margin assigned to that position.
Conceptually:
BTC POSITION
     ↓
Dedicated Margin
Cross Margin is different:
           FUTURES ACCOUNT
                 │
          Shared Resources
                 │
      ┌──────────┼──────────┐
      ↓          ↓          ↓
     BTC        ETH        SOL
Now add to BTC.
The event is not simply:
BTC Size ↑
It can also mean:
BTC Maintenance Requirement ↑
        ↓
Shared Account Requirement ↑
        ↓
Available Account Buffer ↓
If ETH is already losing heavily:
ETH Unrealized P&L ↓
then BTC is being increased inside an account whose supporting resources are already under pressure.
This is why Cross Margin liquidation is an account event, not merely a BTC price event.
For the full mechanism, see:
What Actually Triggers Liquidation in Cross Margin?
Funding can also move that account state without a new order: Can Funding Fees Move Your Liquidation Price?
Adding to a Losing Position Is Not the Same as Adding Margin
These two actions are often mentally mixed together.
They are completely different.
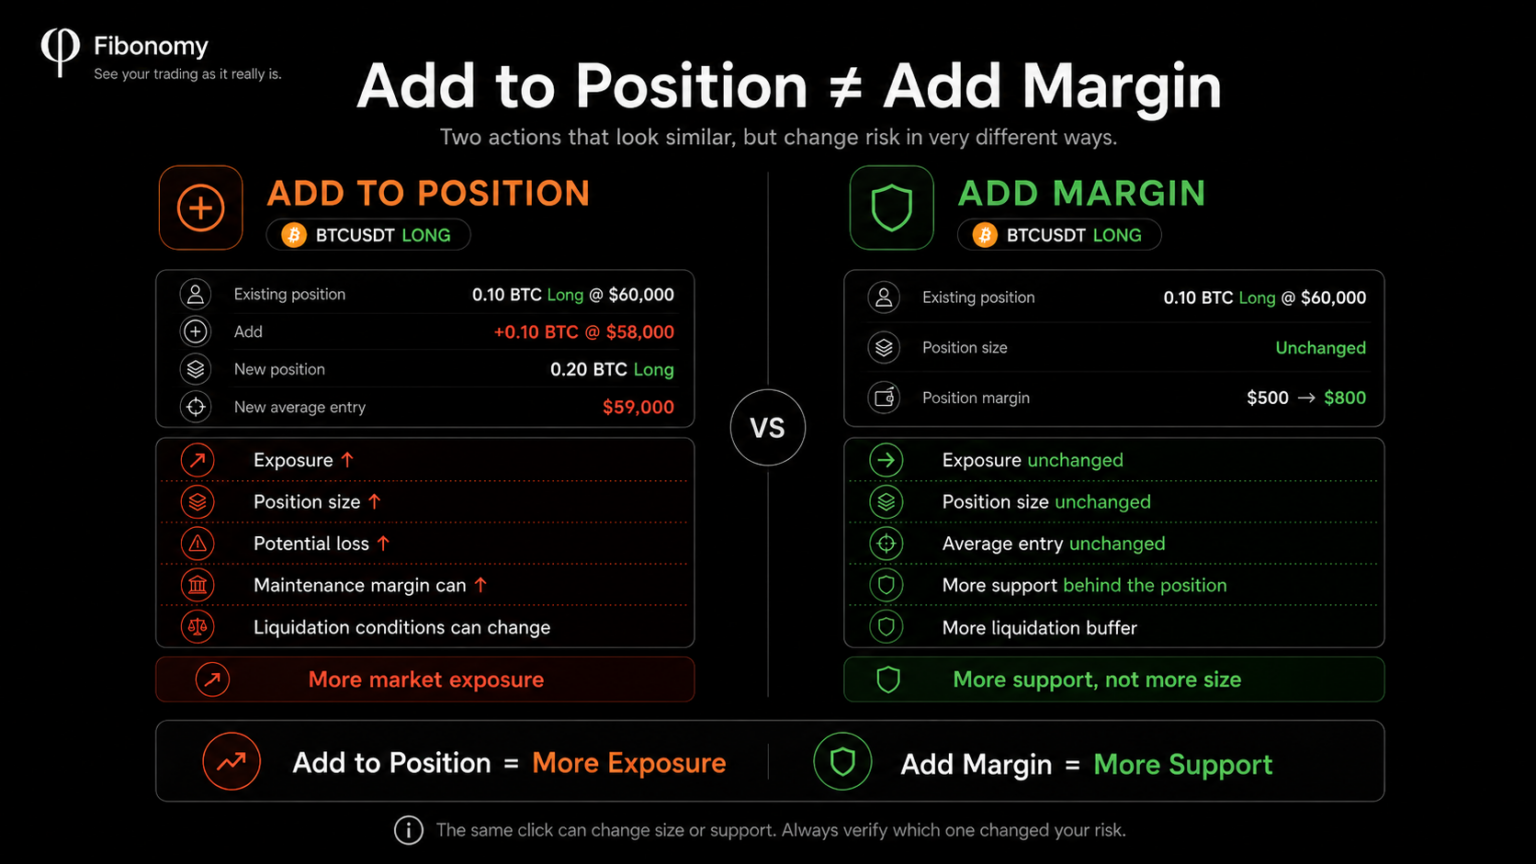
Add to Position
You buy more contracts.
Example:
0.10 BTC LONG

+

0.10 BTC LONG

=

0.20 BTC LONG
Result:
Exposure ↑
Position Size ↑
Average Entry changes
Maintenance Requirement can ↑
Add Margin
You add collateral to support the existing position.
Example:
Position Size:
0.10 BTC

Before Added Margin:
$500 position margin

After Added Margin:
$800 position margin
The position itself may remain:
0.10 BTC
You increased the resources supporting it, not the market exposure.
The distinction is:
ADD TO POSITION

More Exposure
versus:
ADD MARGIN

More Support
These can affect liquidation very differently.
Bybit’s isolated-margin liquidation formulas explicitly separate Extra Margin Added from Position Size.
CoinEx also separately defines adding positions and adding margin as different events in its liquidation calculations.
Adding to a Winner Changes Risk Too
The same principle applies when you size into a profitable position.
Suppose:
BTC LONG

0.10 BTC @ $60,000
BTC moves to:
$64,000
You add:
0.10 BTC @ $64,000
New average entry:
($6,000 + $6,400)
÷
0.20

=
$62,000
Your average entry moved up:
$60,000
→
$62,000
That may look worse.
But the position was profitable before the addition.
Again:
Average Entry Direction
by itself does not tell you whether the decision increased or decreased account risk.
You need to know:
New Size

New Stop

New Account Equity

New Maintenance Requirement

New Liquidation State
The same rule applies whether you call it:
- averaging down,
- averaging up,
- scaling in,
- sizing up,
- or adding to the trade.
Unrealized P&L Can Look Strange Immediately After Adding
Another common source of confusion:
Before adding, your old position may show a large unrealized loss.
You add at the current market price.
The average entry moves toward the market.
Suddenly the percentage loss displayed beside the position may look smaller.
That does not mean the previous loss disappeared.
You simply changed the cost basis and position size used to represent the combined open position.
Bybit documents Average Entry Price as a weighted calculation across opening orders, and CoinEx similarly recalculates the average opening cost when positions are added.
This distinction matters:
Displayed P&L %
changed
does not necessarily mean:
Economic loss
was erased
You changed the position.
The display changed with it.
One Add Can Change Five Numbers at Once
Imagine the screen before adding:
BTCUSDT LONG

Size             0.10 BTC
Average Entry    $60,000
Mark Price       $58,000
Stop             $57,000
Potential Loss   $300
Then:
ADD 0.10 BTC @ $58,000
After:
BTCUSDT LONG

Size             0.20 BTC
Average Entry    $59,000
Mark Price       $58,000
Stop             $57,000
Potential Loss   $400
At the same time:
Position Value ↑

Maintenance Margin ↑

Liquidation Price changes

Available Margin may ↓
So one click:
BUY
can create multiple account changes.
This is why reconstructing only the order itself is insufficient.
The real event is:
ADD EXECUTED
      ↓
Position Size Changed
      ↓
Average Entry Changed
      ↓
Maintenance Requirement Changed
      ↓
Liquidation State Changed
      ↓
Capital at Risk Changed
That is the useful chain.
Does Adding Lower Your Liquidation Risk?
Sometimes the displayed liquidation price may move farther away.
Sometimes it may move closer.
Sometimes the position-level number may look safer while the account-level state becomes worse.
The answer depends on the full account configuration.
So there is no responsible universal rule like:
Average Down
=
Safer Liquidation
or:
Adding
=
Always Closer to Liquidation
Both are too simplistic.
A more accurate statement is:
Adding changes the position. You must recalculate risk after the addition.
CoinEx explicitly recalculates liquidation price when positions are added.
On Bybit Cross Margin, liquidation is ultimately account-level through Maintenance Margin conditions, while position values and Maintenance Margin are affected by Mark Price and risk tiers.
On OKX, larger position tiers can carry higher Maintenance Margin requirements, while estimated liquidation price itself can continuously change and is described as a reference value.
What Should You Recalculate After Adding?
When you add to a futures position, check these again.
1. Position Size
Old Size
vs
New Size
2. Average Entry Price
What did the new fill do to the cost basis?
3. Potential Loss to Stop
New Size
×
Distance to Stop
Do not keep using the old risk number.
4. Capital Risk Percentage
Potential Loss
÷
Current Account Equity
×
100
5. Maintenance Margin
Did the larger position increase the requirement?
6. Risk Tier
Did position notional cross into another tier?
7. Liquidation Price
Was it recalculated?
8. Account Margin State
Especially in Cross Margin:
Did increasing this position reduce the buffer supporting every other open position?
Those are the numbers that describe the new trade.
Not the numbers from before you clicked Buy. After you add to a futures position, recalculate the position as if you were evaluating it again from scratch.
The Better Question
A trader often asks:
“Did I get a better entry?”
That is useful.
But incomplete.
After adding, ask:
“What did I gain in entry price, and what did I give up in account risk?”
Compare:
BEFORE

Size
Average Entry
Stop
Potential Loss
Maintenance Margin
Liquidation State
with:
AFTER

Size
Average Entry
Stop
Potential Loss
Maintenance Margin
Liquidation State
Then the decision becomes visible.
You might discover:
Average Entry improved
$1,000
while:
Capital Risk increased
3% → 4%
Or:
Maintenance Margin doubled
Or:
The account entered a higher risk tier
That is much more informative than:
“My entry is better now.”
The Bottom Line
When you add to a futures position, you are not simply changing your entry price. Every time you add to a futures position, the old risk calculation is no longer enough.
You are changing the position itself.
That can change:
- position size,
- average entry price,
- P&L sensitivity,
- Maintenance Margin,
- risk tier,
- liquidation price,
- available margin,
- and total account capital at risk.
Averaging down can improve the visible entry price while increasing the amount of money exposed.
Scaling into a winner can worsen the average entry while still being part of a controlled risk plan.
The direction of Average Entry Price does not tell you the direction of risk.
So after every addition, do not ask only:
“Where is my new entry?”
Ask:
“What is the new position, and how much of my account is now exposed if it fails?”
That is the number that matters.
See What Changed After You Sized Up
Fibonomy reconstructs position changes so you can see what happened to size, average entry, protection, liquidation conditions, and account-level capital risk after you add to a position.
Not a signal. Perpetual futures can produce rapid losses and liquidation. This article explains position and margin mechanics and is not personalized trading or investment advice.
Sources
Bybit — Average Entry Price (Perpetual and Expiry Contracts)
How additional opening orders change the weighted Average Entry Price of USDT, USDC and inverse futures positions.
Bybit — P&L Calculations for USDT Contracts
How adding to a position changes Average Entry Price and the inputs used to calculate open P&L.
Bybit — New Margin Calculation: Adjustments and Implications
How Cross and Isolated Maintenance Margin calculations use Mark Price and dynamic risk-limit tiers.
OKX — Leverage Gradient / Tiered Maintenance Margin System
How larger positions can move into higher tiers with higher Maintenance Margin requirements and lower maximum leverage.
OKX — How Liquidation Works in Futures Trading
Maintenance Margin Ratio, Mark Price and continuously changing estimated liquidation price.
CoinEx — Liquidation Price for USDⓈ-Margined Contracts
Adding a position as an explicit event that causes liquidation price to be recalculated.
CoinEx — Margin Terms
Position size, Average Entry Price, available margin and recalculation of position value after adding.
Binance — USDⓈ-M Futures Notional and Leverage Brackets
Binance Futures uses symbol-specific notional and leverage brackets rather than a single fixed margin structure for all position sizes.