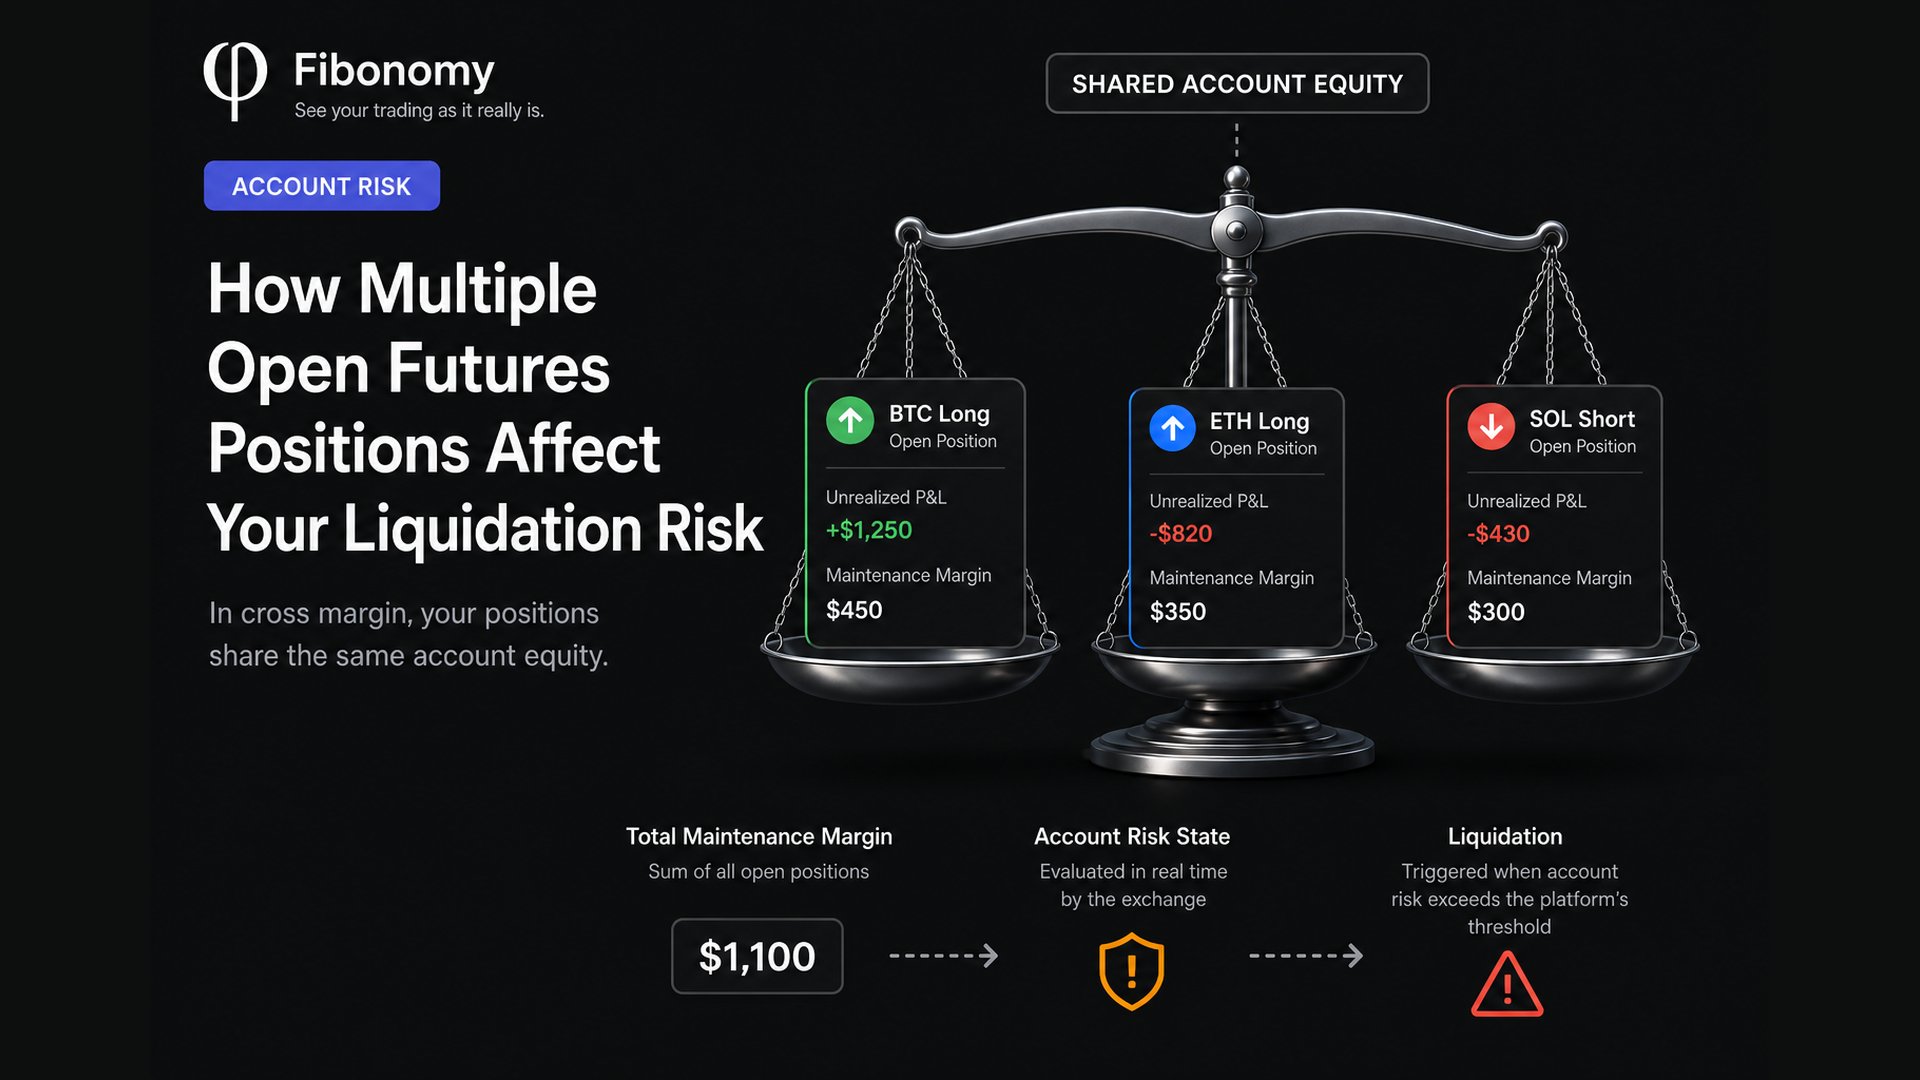
Having three open futures positions does not simply mean having three separate risks.
In cross margin, those positions can become parts of the same account-level system. For how equity, maintenance margin, and risk ratios combine into that trigger, see What Actually Triggers Liquidation in Cross Margin?.
One position may be profitable. Another may be losing. A third may have barely moved.
But the exchange may still be using the same pool of account equity to support all of them.
That changes the question.
Instead of asking:
“How close is this position to liquidation?”
you may need to ask:
“What are all of my open positions doing to the account that supports them?”
That distinction matters because another position can affect both the equity available to your account and the maintenance margin your account needs to keep positions open.
Quick Answer
With multiple open futures positions in cross margin, the positions are not fully independent.
Depending on the exchange and account mode:
- unrealized profit from one position may help support losses elsewhere,
- unrealized losses can reduce the equity supporting the entire account,
- every additional position may add maintenance-margin requirements,
- larger positions can move into higher risk tiers,
- and the liquidation condition may be evaluated using account-level risk rather than one position in isolation.
On Binance USDⓈ-M Futures, the published cross-margin liquidation formula explicitly includes both the maintenance margin and unrealized P&L of other contracts when calculating the liquidation price of a position.
Bybit takes the account-level idea even further in its Unified Trading Account: in cross margin, liquidation is triggered when the Account Maintenance Margin Rate reaches 100%, while the liquidation price displayed beside a position is an estimate rather than the actual trigger.
So when you have multiple positions open, looking at each position separately can hide part of the picture.
Table of Contents
One Account, Several Positions
Imagine this account:
Account wallet balance        $10,000

BTC Long                      Open
ETH Long                      Open
SOL Short                     Open
On the screen, you see three rows.
That presentation naturally makes them feel separate:
BTC Position
ETH Position
SOL Position
But under cross margin, the risk engine may see something closer to:
                    ACCOUNT
                       │
              Shared Account Equity
                       │
          ┌────────────┼────────────┐
          │            │            │
       BTC Long     ETH Long     SOL Short
          │            │            │
          └────────────┼────────────┘
                       │
           Total Maintenance Margin
                       │
                Account Risk State
                       │
                  Liquidation
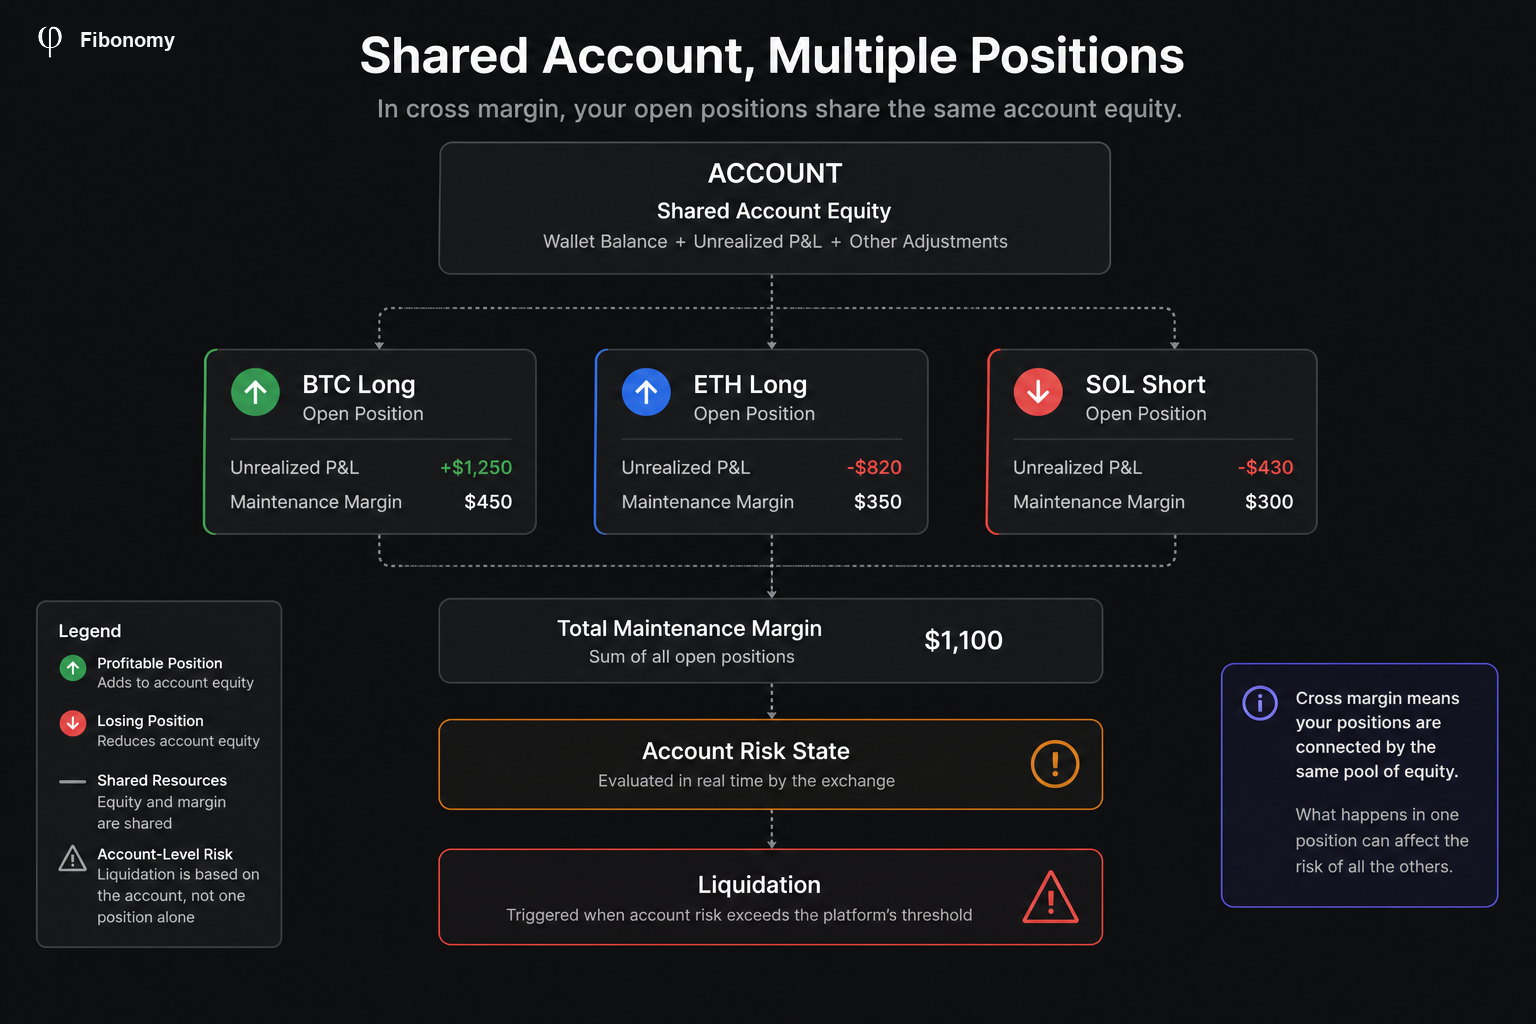
The important shift is simple:
A position is visible as an individual object, but its survival may depend on conditions across the account.
That is the part traders can easily miss.
A Profitable Position Can Help a Losing One
Start with two positions:
BTC Long
Unrealized P&L       +$1,200

ETH Long
Unrealized P&L       -$800
Across those two positions:
+$1,200
-$  800
────────
+$  400
The profitable BTC position is contributing positive unrealized P&L to the account.
Under cross-margin systems that allow P&L to offset across derivatives positions, that positive P&L can improve the account state supporting the losing ETH position.
Bybit explicitly lists the ability to offset P&L between derivatives positions as a feature of its cross-margin mode.
Binance’s cross-margin liquidation calculation likewise includes the unrealized P&L of the other open contracts when calculating a position’s liquidation price.
This can make cross margin look forgiving.
But there is another side to the same mechanism.
A Losing Position Can Pull the Rest of the Account Toward Liquidation
Now change the numbers:
BTC Long
Unrealized P&L       +$400

ETH Long
Unrealized P&L       -$2,100

SOL Long
Unrealized P&L       -$900
Combined:
+$  400
-$2,100
-$  900
────────
-$2,600
Nothing had to happen to the BTC entry price.
BTC itself might still be profitable.
But the account supporting BTC has lost $2,600 of unrealized value across its open positions.
That distinction is fundamental:
BTC Position State
        ≠
Account State
A position can look healthy while the account around it is becoming weaker.
This is also why the liquidation price displayed beside a cross-margin position can move as other positions gain or lose value.
If that specific problem is what brought you here, see our earlier explanation of why liquidation price changes in cross margin.
Opening Another Position Can Increase Risk Before It Loses a Dollar
This is one of the less obvious parts.
Suppose your account currently looks like this:
Account Equity                     $10,000

BTC Maintenance Margin                $400
ETH Maintenance Margin                $300

Total Maintenance Margin              $700
Now you open a new SOL position. Adding or sizing up a futures position can change more than exposure — including average entry, maintenance margin, and liquidation price. See What Happens to Liquidation Risk When You Add to a Futures Position?.
At the moment of entry, assume its unrealized P&L is approximately zero.
But it requires another:
SOL Maintenance Margin $650
Now:
Account Equity                     $10,000

BTC Maintenance Margin                $400
ETH Maintenance Margin                $300
SOL Maintenance Margin                $650
──────────────────────────────────────────
Total Maintenance Margin            $1,350
For teaching purposes, think of the account’s remaining maintenance buffer as:
Account Equity
-
Required Maintenance Margin
This is not an exchange liquidation formula. It is only a simplified way to see what changed.
Before SOL:
$10,000 - $700
=
$9,300 simplified buffer
After SOL:
$10,000 - $1,350
=
$8,650 simplified buffer
No position had to lose money.
No funding payment was required.
No market crash occurred.
You simply asked the same account to support more open risk.
That added maintenance requirement changed the account.
On Binance, maintenance margin depends on position notional and the applicable maintenance-margin tier. Its published cross-margin formula also includes the maintenance margin of all other contracts when calculating liquidation price.
This is why:
More positions do not only create more P&L. They also create more margin requirements.
More Positions Create Two Moving Sides of the Equation
Once several positions are open, two broad things can change at the same time.
On one side:
ACCOUNT EQUITY

Wallet balance
+
Unrealized P&L
+
Other relevant account changes
On the other:
MARGIN REQUIREMENTS

BTC maintenance margin
+
ETH maintenance margin
+
SOL maintenance margin
+
...
So your account can become more fragile in several ways.
Scenario A — Losses reduce equity
Equity ↓
Margin requirement unchanged
The available buffer becomes smaller.
Scenario B — Another position is opened
Equity roughly unchanged
Maintenance margin ↑
Again, the buffer becomes smaller.
Scenario C — Both happen together
Equity ↓
Maintenance margin ↑
Now the account is being squeezed from both sides.
This is the scenario that becomes difficult to understand when an exchange interface shows each position as an isolated row.
The Worst Position Is Not Always the Whole Problem
Suppose you see:
BTC       -$1,400
ETH         -$650
SOL         +$200
It is tempting to conclude:
“BTC is the risky position.”
BTC certainly contributes the largest current unrealized loss.
But account-level liquidation risk is not necessarily explained by the largest loss alone.
The picture may also depend on:
- how large each position is,
- each position’s maintenance-margin requirement,
- its risk tier,
- whether another position is profitable or losing,
- account equity,
- and the exchange’s cross-margin model.
A smaller position can still consume meaningful maintenance margin.
A profitable position can improve account equity while still requiring maintenance margin to remain open.
And a position that looks harmless at one moment may become a major contributor after a correlated market move.
So there are really two different questions:
Which position is losing the most?

versus

Which positions are contributing most
to the account's liquidation risk?
They are not always the same question.
See the account behind the position
What are your positions really doing to your account?
Connect your exchange. See margin, funding, and liquidation in one place.
Correlation Can Make Multiple Positions Behave Like One Large Trade
Consider:
BTC Long
ETH Long
SOL Long
These are three different positions.
But during a broad crypto selloff, all three may lose value at roughly the same time.
The account can then experience:
BTC P&L ↓
ETH P&L ↓
SOL P&L ↓
      │
      ↓
Account Equity ↓
while all three positions still require maintenance margin.
The screen says:
3 positions
The account may experience something closer to:
1 shared directional shock
Now consider instead:
BTC Long
ETH Short
If the positions genuinely offset one another under the relevant market conditions, gains on one side may cushion losses on the other.
But that does not mean every pair of opposite positions is a perfect hedge, and standard cross-margin systems should not be confused with portfolio-margin systems.
Bybit explicitly distinguishes the two: under cross margin, margin calculations remain based on individual positions, while portfolio margin evaluates the risk of the portfolio and may reduce margin requirements when positions hedge one another.
That distinction matters.
Cross margin shares resources. Portfolio margin may additionally recognize portfolio-level offsets.
They are not the same thing.
A Worked Example
Let’s put the pieces together.
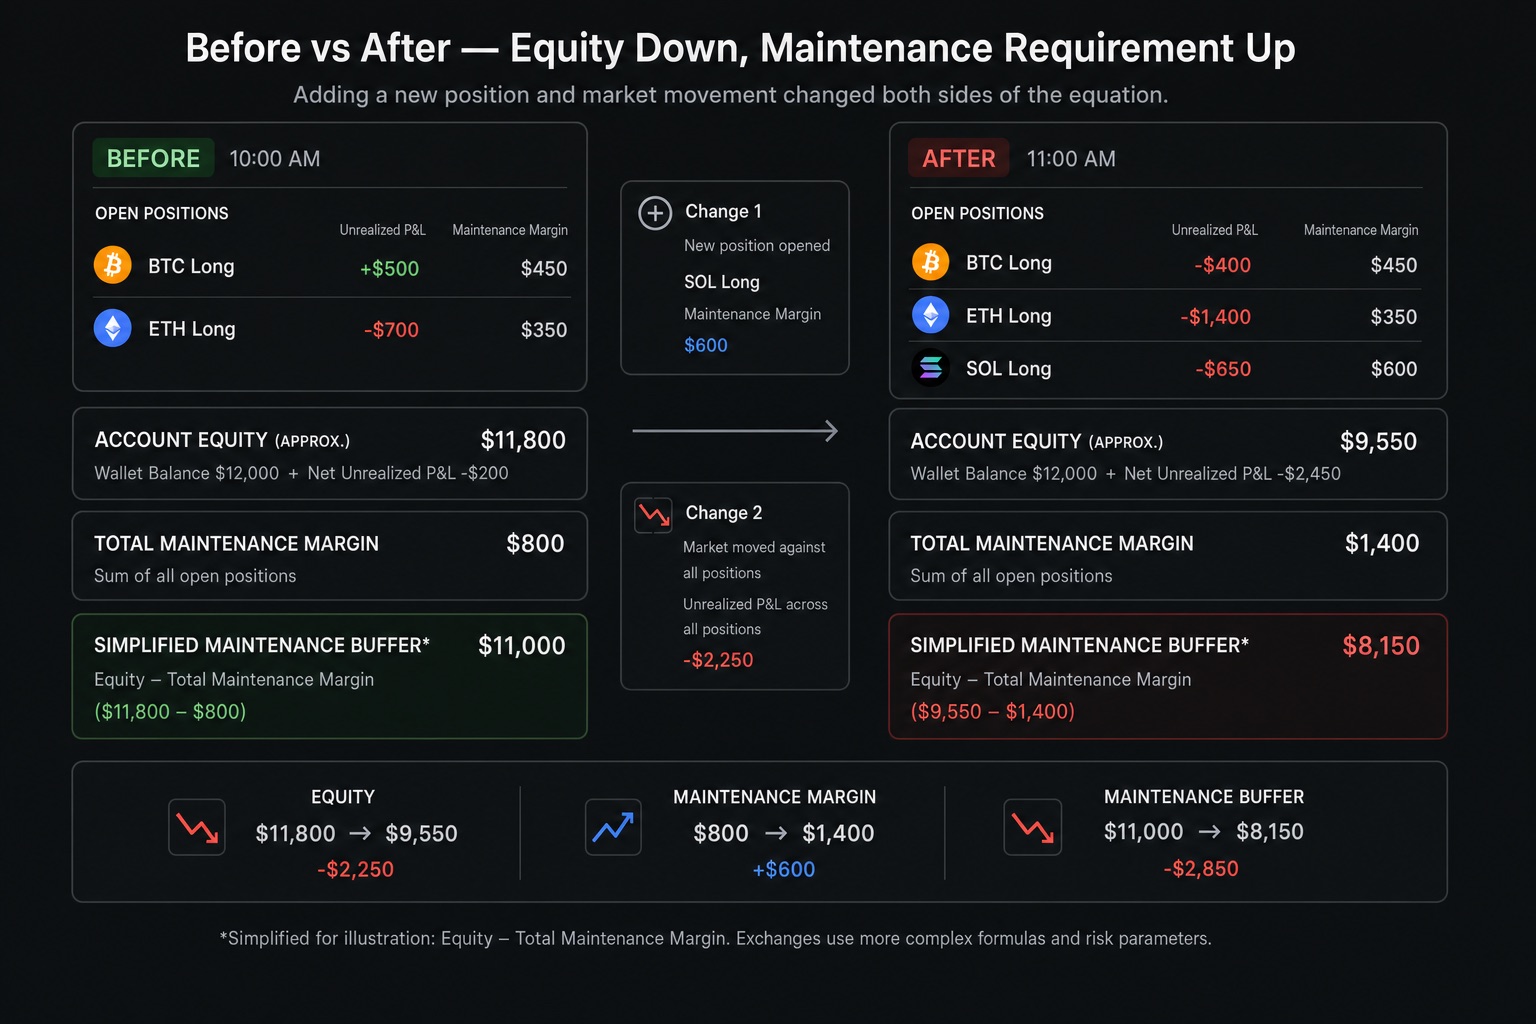
At 10:00:
Wallet Balance                    $12,000

BTC Long
Unrealized P&L                      +$500
Maintenance Margin                   $450

ETH Long
Unrealized P&L                      -$700
Maintenance Margin                   $350
Simplified account view:
Wallet Balance                    $12,000
Net Unrealized P&L                  -$200
────────────────────────────────────────
Approx. Equity                    $11,800

Total Maintenance Margin             $800
Now at 10:30, you open SOL:
SOL Long
Unrealized P&L                         $0
Maintenance Margin                   $600
Approximate equity is still:
$11,800
But total maintenance margin becomes:
$450 + $350 + $600
=
$1,400
Then the market drops.
At 11:00:
BTC P&L                            -$400
ETH P&L                          -$1,400
SOL P&L                            -$650
Combined unrealized P&L:
-$2,450
Approximate equity:
$12,000 - $2,450
=
$9,550
Now compare the account:
10:00
2 positions
Approx. equity        $11,800
Maintenance margin       $800

            ↓

11:00
3 positions
Approx. equity         $9,550
Maintenance margin     $1,400
The important change is not simply:
“SOL lost $650.”
The account experienced two changes:
Required maintenance margin increased
+
Available equity decreased
That is a much better explanation of what happened.
Again, the example above is deliberately simplified. Actual liquidation mechanics vary by exchange, contract, account mode, fees, collateral rules, mark price, risk tiers, and other parameters.
Different Exchanges Express the Same Problem Differently
There is no universal cross-margin liquidation formula that you can apply unchanged to every crypto exchange.
For example:
Binance
For USDⓈ-M Futures in cross margin, Binance’s published liquidation formula incorporates:
- cross-wallet balance,
- maintenance margin from other contracts,
- unrealized P&L from other contracts,
- the target position,
- its maintenance-margin rate,
- and other position parameters.
That is direct evidence that the liquidation price of one cross-margin position can depend on other open contracts.
Bybit
Under the Unified Trading Account in cross margin, Bybit uses an account maintenance-margin rate as the liquidation trigger.
Liquidation begins when the account MMR reaches 100%.
The liquidation price shown beside a derivatives position is therefore an estimate for reference; the account-level MMR is the actual trigger.
OKX
OKX also uses maintenance-margin ratios in its cross-margin models and states that estimated liquidation prices change continuously.
Its documentation notes that account and position state are evaluated in real time, and liquidation or reduction may begin when the applicable maintenance-margin ratio reaches the liquidation threshold.
The formulas differ.
The user problem does not:
One position can no longer be understood without enough context about the account around it.
What to Look at When You Have Multiple Open Positions
If you’re trying to understand why your account’s liquidation situation changed, looking only at entry price and leverage leaves out too much.
Reconstruct these pieces:
1. Account equity
How much equity is currently supporting the cross-margin account?
2. Unrealized P&L across all relevant positions
Not just the position you’re worried about.
3. Maintenance margin by position
Which positions are consuming the largest share of required maintenance margin?
4. Position changes
Was a position added, increased, reduced, or closed?
5. Risk-tier changes
Did a larger notional move a position into another maintenance-margin tier?
6. Funding and fees
Did the account change even though no manual trade occurred? Funding can move equity and liquidation conditions while you place no new trade. See Can Funding Fees Move Your Liquidation Price?.
7. Margin mode
Are you actually looking at cross margin, isolated margin, or portfolio margin?
These are different systems.
The point is not to memorize another formula.
It is to stop treating the liquidation number as if it appeared independently of everything else in the account.
What the Position List Doesn’t Show Clearly
A typical exchange screen might show:
BTC    +$420
ETH    -$860
SOL    -$190
Useful.
But incomplete.
What you may actually want to know is:
Account Equity                  $9,840

Total Capital at Risk             2.6%

Largest Risk Contributor
ETH                               1.4%

BTC                               0.7%
SOL                               0.5%

What changed?
SOL position opened              +$12,000 notional
ETH unrealized loss               -$860
Funding                            -$34
That is a different view of the same trading account.
It moves from:
three position rows
to:
one account story
And that is often the context missing when multiple open positions start interacting.
To measure the combined planned loss of those positions against account equity, see How Much of Your Account Is at Risk Across Open Futures Positions?
The Bottom Line
Multiple open futures positions in cross margin do not exist as completely separate risk containers.
They can share account equity.
Their unrealized profits and losses can affect the same account state.
Each position can add maintenance-margin requirements.
And the liquidation condition may depend on the account as a whole rather than the position you happen to be looking at.
So the useful question is not only:
“Which position is closest to liquidation?”
It is:
“How are all of my open positions changing the account that keeps them alive?”
Once you can see that, liquidation risk stops looking like a collection of unrelated numbers and starts looking like a system.
See Which Positions Are Driving Your Account Risk
Fibonomy brings your open positions together so you can see how much of your account is actually at risk, which positions contribute most, and what changed across the account.
This content is for educational purposes only and does not constitute financial, investment, or trading advice. Margin and liquidation mechanics vary by exchange, instrument, margin mode, account configuration, and platform rules.
Sources
Binance — How to Calculate Liquidation Price of USDⓈ-M Futures Contracts
https://www.binance.com/en/support/faq/detail/b3c689c1f50a44cabb3a84e663b81d93
Bybit — Differences Between the Margin Modes Under the Unified Trading Account
https://www.bybit.com/en/help-center/article/Differences-Between-the-Margin-Modes-Under-the-Unified-Trading-Account
Bybit — Trading Rules: Liquidation Process (Unified Trading Account)
https://www.bybit.com/en/help-center/article/UTA-Trading-Rules
Bybit — Introduction to Unified Trading Account
https://www.bybit.com/en/help-center/article/Introduction-to-Bybit-Unified-Trading-Account
OKX — How Does Liquidation Work in Futures Trading?
https://www.okx.com/en-ar/help/frequently-issues-of-contracts-for-compulsory-liquidation