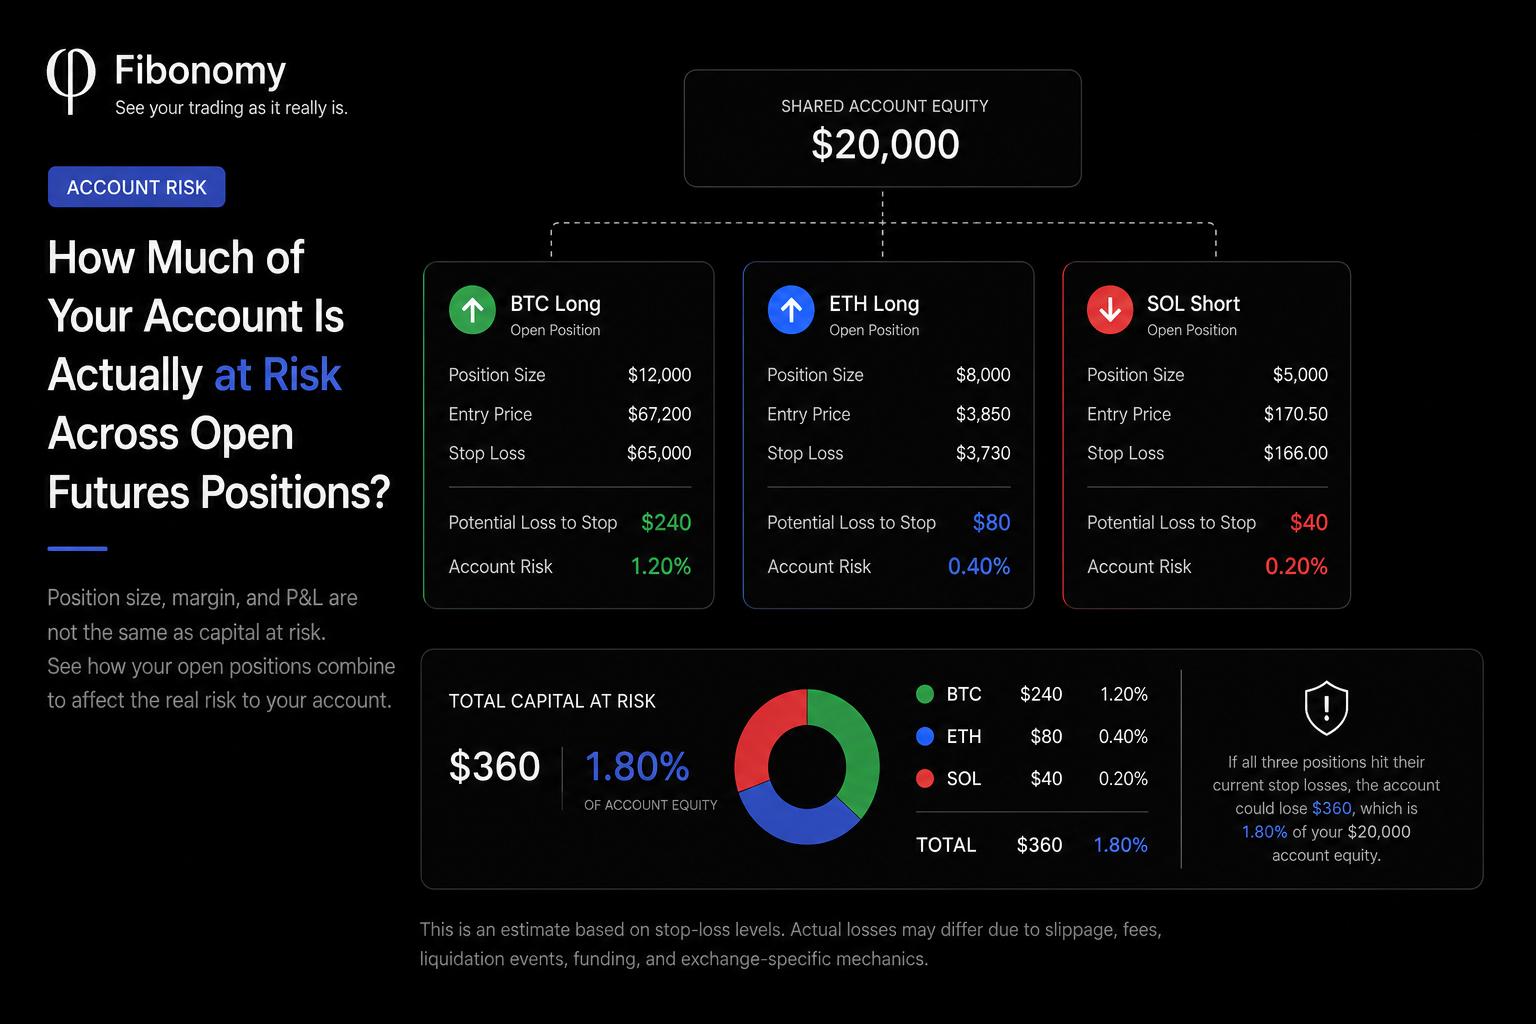
Understanding risk across open futures positions is harder than adding up position size, margin, or current P&L.
You have three futures positions open.
Your exchange shows:
- $42,000 in total position value,
- $5,600 of margin in use,
- $310 of unrealized profit,
- three liquidation prices,
- and a different leverage number beside each position.
So how much of your account is actually at risk?
None of those numbers answers the question by itself.
That is the problem.
A trader can know the size of every position and still not know how much capital could be lost if all of those positions move against their planned exits.
This article measures planned capital at risk: the combined potential loss if current protective exits are reached. It is not a guide to how cross-margin liquidation prices interact. Those mechanics are covered in How Multiple Open Futures Positions Affect Your Liquidation Risk and Why Does My Liquidation Price Keep Changing in Cross Margin?
Quick Answer
A useful way to think about capital at risk is:
How much would the account lose if the current protective exit for each open position were reached?
For a position with a valid stop loss, that usually means estimating the loss between the position’s current cost basis and its stop, based on the position size. A stop is still not a guarantee that liquidation cannot happen first.
Then the risks of the open positions can be considered together:
Total Open Risk ($)
=
Position Risk 1
+
Position Risk 2
+
Position Risk 3
+ ...
and:
Total Capital Risk (%)
=
Total Open Risk
÷
Account Equity
× 100
But there is an important complication.
If one of your positions has no valid stop, you no longer have a clean planned-loss boundary for that position.
And in cross margin, simply substituting a liquidation price is not always straightforward because liquidation itself may depend on the state of the entire account.
Bybit, for example, currently evaluates liquidation in cross margin at the account level using the Account Maintenance Margin Rate rather than treating every displayed liquidation price as an independent trigger.
So before calculating account risk, we need to separate a few numbers that are often confused.
Table of Contents
Position Size Is Not Capital at Risk
Suppose you have:
Account Equity      $20,000

BTC Position Size   $12,000
Does that mean $12,000 of your account is at risk?
No.
The $12,000 describes your position exposure.
Now suppose the position would lose approximately $240 if its stop were executed as planned.
Then:
Position Size        $12,000

Potential Loss
to Stop                 $240
Those are radically different numbers.
Relative to the account:
$240 ÷ $20,000
=
1.2%
So in this simplified example:
Position Size          $12,000
Capital at Risk           $240
Capital at Risk %          1.2%
A large position can have relatively small planned risk if the protective exit is close.
And a much smaller position can carry more planned risk if its stop is much farther away.
That is why:
Position size tells you how much market exposure you have. It does not tell you how much of your account you stand to lose.
Margin Is Not Capital at Risk Either
Now suppose the same BTC position uses:
Margin Used $2,400
We now have three numbers:
Position Size       $12,000
Margin Used          $2,400
Risk to Stop           $240
They answer three different questions.
Position size
How much market exposure does the position represent?
Margin
How much collateral is currently required or allocated to support that leveraged exposure?
Risk to stop
How much could the position lose if the protective exit is reached and executes around the expected level?
Leverage changes the relationship between position size and margin.
It does not automatically tell you the loss you have planned to accept.
OKX describes margin as a proportion of the overall leveraged contract value and notes that leverage can magnify losses from relatively small market movements.
So this shortcut is wrong:
Margin Used
=
Capital at Risk
They are not interchangeable.
Current P&L Is Not Capital at Risk
There is another number traders often mistake for risk:
Unrealized P&L
Suppose the BTC position is currently:
+$180
That tells you what the position is worth relative to its current mark-to-market state.
It does not tell you what happens if price moves to your stop.
You could have:
Current P&L           +$180

Potential Loss
at Stop                -$240
Or:
Current P&L           -$100

Potential Loss
at Stop                -$240
The planned downside is still a separate question.
So now we have four distinct concepts:
POSITION SIZE
How much exposure exists?

MARGIN
How much collateral supports it?

CURRENT P&L
Where is the position now?

CAPITAL AT RISK
What could be lost at the protective boundary?
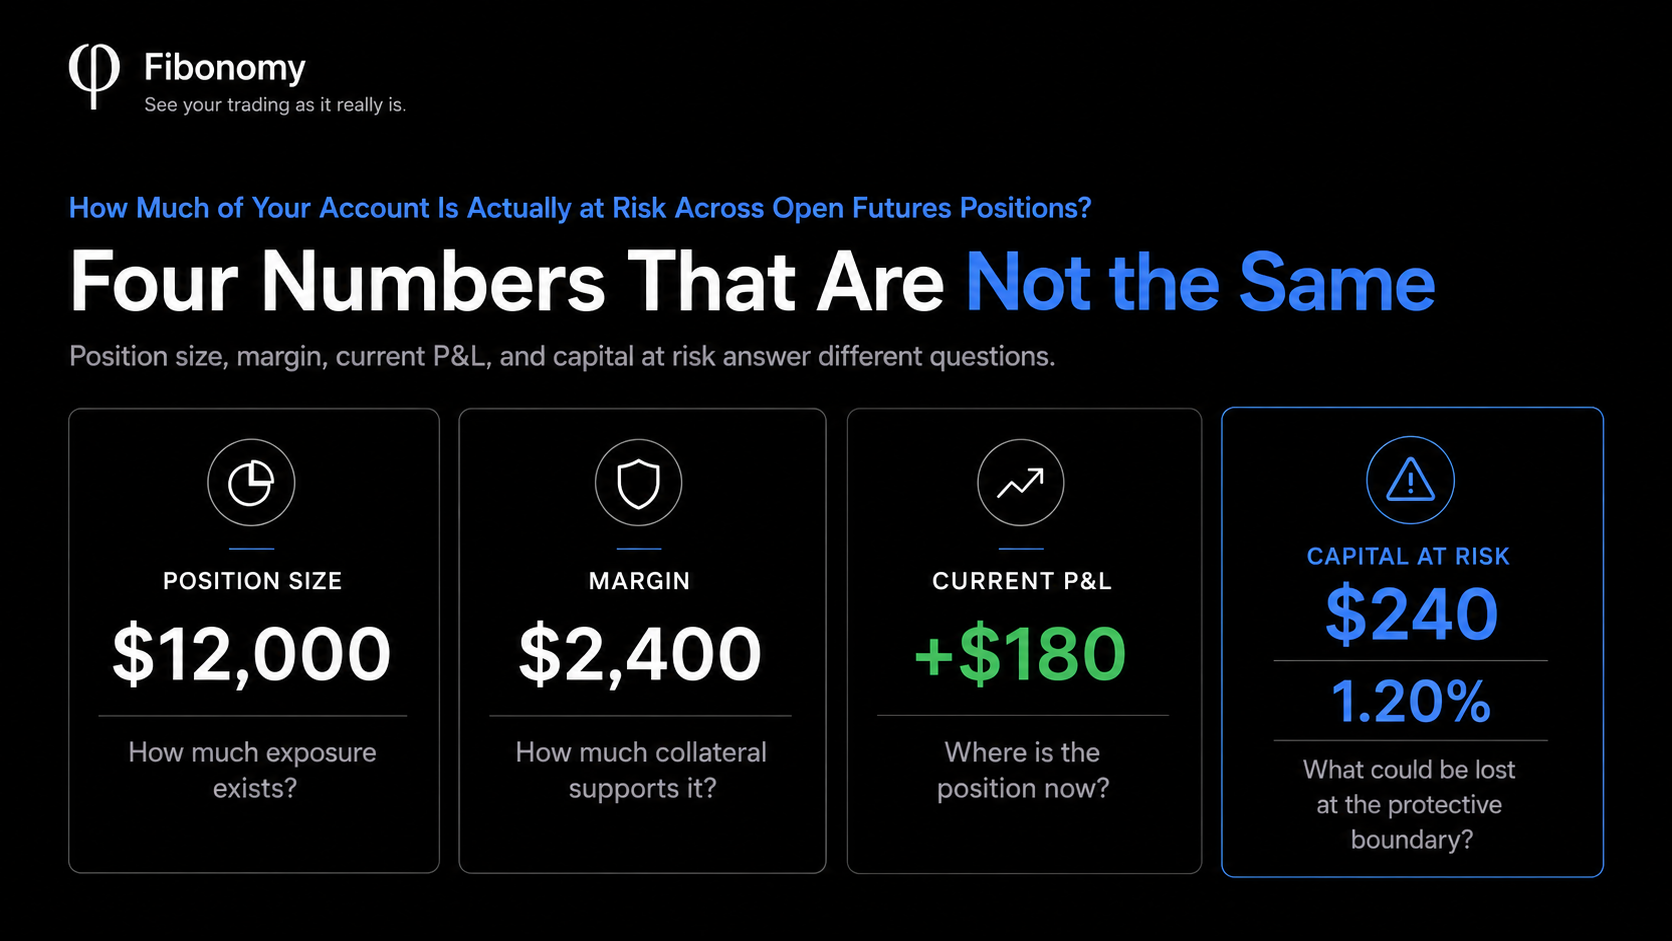
This distinction becomes much more important once several positions are open at the same time.
How to Measure Risk Across Open Futures Positions
Consider a $20,000 account with three open positions.
BTC
Position Size       $12,000
Risk to Stop           $240
ETH
Position Size        $8,000
Risk to Stop            $80
SOL
Position Size        $5,000
Risk to Stop            $40
Total position exposure:
$12,000
+ $8,000
+ $5,000
────────
$25,000
The account therefore has:
$25,000
of notional open exposure.
That is:
125%
of its $20,000 equity.
But total potential loss to the three stops is:
$240
+ $80
+ $40
──────
$360
Relative to equity:
$360 ÷ $20,000
=
1.8%
So the same account can simultaneously have:
Open Position Value       $25,000
                          125% of equity

Capital at Risk               $360
                            1.8% of equity
Those numbers are not contradictory.
They measure different things.
This is why simply adding position sizes or margin amounts cannot answer:
“How much of my account is actually at risk?”
One Missing Stop Changes the Answer
Now change the example.
BTC has a valid stop:
Risk $240
ETH has a valid stop:
Risk $80
But SOL has no stop.
You might be tempted to calculate:
$240 + $80
=
$320
and report:
1.6% account risk
That would be misleading.
Because the SOL position still exists.
Its downside did not disappear because you cannot calculate a clean stop-based number.
The truthful state is closer to:
BTC Risk             $240
ETH Risk               $80
SOL Risk           UNKNOWN
Therefore:
Total Planned Risk
cannot be fully established
This is an important principle:
Missing risk data is itself risk information.
A dashboard that quietly ignores the SOL position would produce a cleaner number.
It would also produce a less truthful one.
What If There Is No Stop Loss?
When a valid stop is missing, there are two very different things you can do.
Option 1 — Admit that planned risk is unknown
This is the cleanest answer if you are trying to measure the trader’s intended downside.
Without a protective boundary, there is no clear answer to:
“Where did this trader decide the loss should stop?”
Option 2 — Use liquidation as a fallback boundary
Liquidation can provide another observable downside boundary.
But it represents something different.
A stop loss is a trader-defined protective exit.
Liquidation is an exchange risk-control event.
Those are not the same thing.
OKX explicitly describes TP/SL and liquidation as independent mechanisms and notes that forced liquidation can occur before a stop loss is triggered if the relevant maintenance-margin condition is reached first.
So:
Stop Loss
=
Planned protective boundary

Liquidation
=
Exchange-enforced failure boundary
Using liquidation as a fallback can be useful when there is no valid stop.
But it should never be presented as if it were the trader’s planned risk.
See the account behind the position
What are your positions really doing to your account?
Connect your exchange. See margin, funding, and liquidation in one place.
Cross Margin Makes Liquidation-Based Risk Harder
In isolated margin, a position’s liquidation state is more self-contained.
Cross margin is different.
Bybit’s current Unified Trading Account documentation says that all available margin is shared across positions in Cross Margin and that liquidation risk is assessed at the account level.
Its documentation also states that the liquidation price displayed beside a cross-margin derivatives position is an estimate for reference, while the account Maintenance Margin Rate reaching 100% is the actual liquidation trigger. That account-level process is explained in What Actually Triggers Liquidation in Cross Margin?.
That creates a problem if you try to calculate:
BTC loss to liquidation
+
ETH loss to liquidation
+
SOL loss to liquidation
as though they were three independent stop prices.
They may not be independent.
The loss of ETH can alter the account state supporting BTC.
Opening another position can change maintenance-margin requirements.
Funding can change equity.
A displayed liquidation estimate can move.
We covered that interaction in:
How Multiple Open Futures Positions Affect Your Liquidation Risk
and:
Why Does My Liquidation Price Keep Changing in Cross Margin?
So if liquidation is being used as a fallback risk boundary, account context matters.
A Stop-Based Risk Number Is Still an Estimate
Even a valid stop does not create a guaranteed maximum loss.
Suppose your calculation says:
Expected Loss to Stop
$240
That assumes the exit happens around the expected stop level.
In real markets, that may not happen exactly.
OKX explicitly warns that stop orders may execute at a different price—or may not fully execute as intended—because of volatility, market depth, order type, and liquidity conditions.
So:
Calculated Risk to Stop
is better understood as:
Expected / planned potential loss
under the current stop configuration
not:
Guaranteed maximum possible loss
That distinction matters especially in fast-moving crypto futures markets.
A Better Account-Level View
Imagine the exchange gives you this:
BTC     $12,000     +$180
ETH      $8,000      -$90
SOL      $5,000       +$0
Useful.
But it still does not answer the account-risk question.
A more useful reconstruction might look like:
ACCOUNT EQUITY
$20,000
Then:
BTC
Position Size         $12,000
Risk Basis             Stop Loss
Potential Loss             $240
Account Risk              1.20%
ETH
Position Size          $8,000
Risk Basis             Stop Loss
Potential Loss              $80
Account Risk              0.40%
SOL
Position Size          $5,000
Risk Basis             Stop Loss
Potential Loss              $40
Account Risk              0.20%
And finally:
TOTAL CAPITAL AT RISK

$360

1.80% of Account Equity
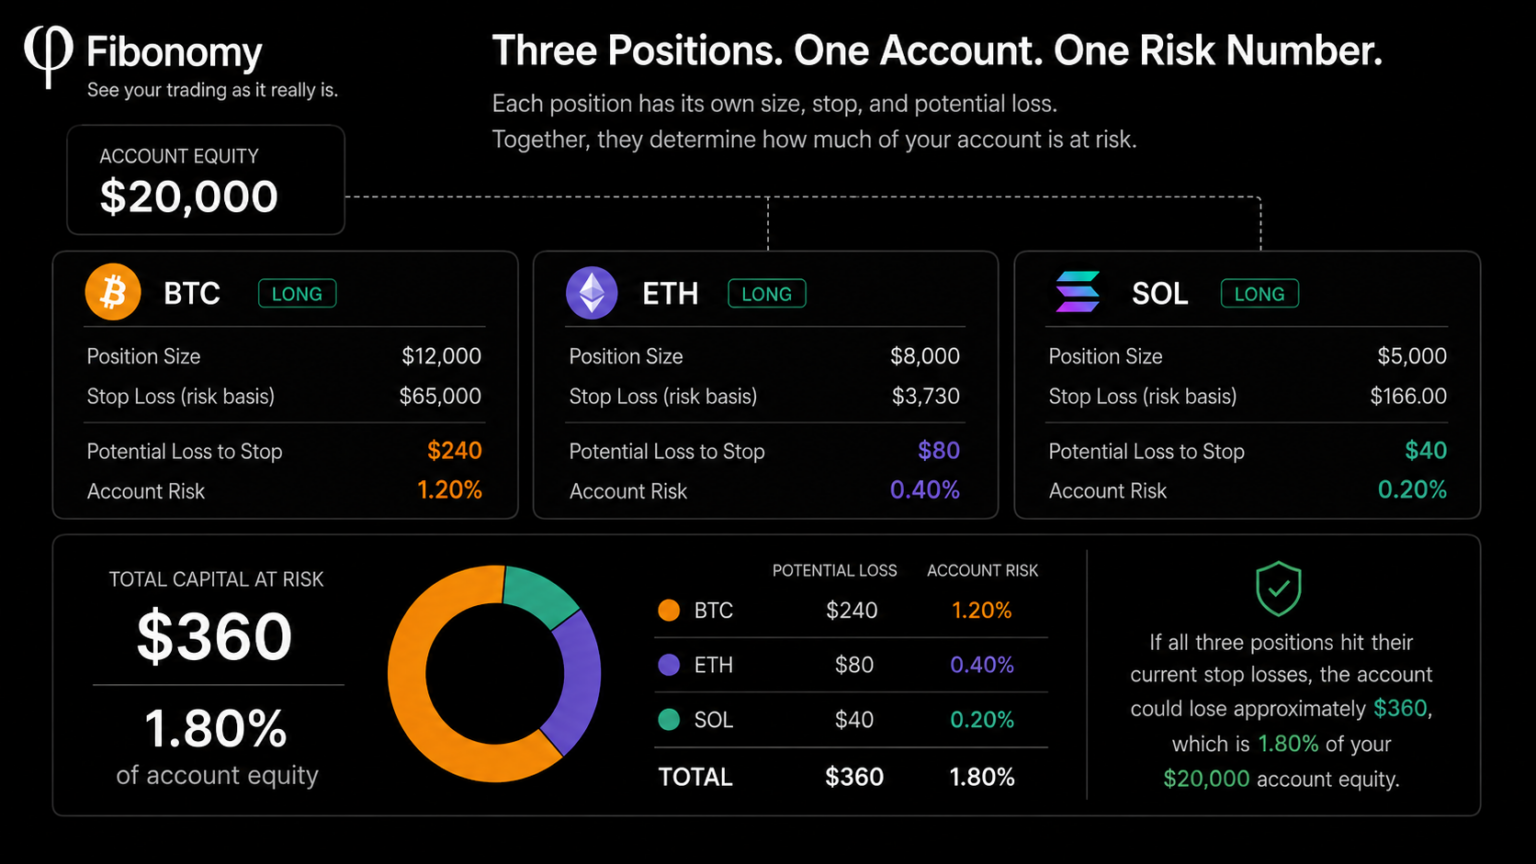
Now the account tells a different story.
Not:
How large are my positions?
but:
How much could I lose
if the current protective boundaries are reached?
That is a much more useful question.
The 2% Number Needs Context
You will often see percentages such as:
1%
2%
5%
used in trading-risk frameworks.
There is no universal percentage that automatically makes a futures account safe.
Different strategies, instruments, account structures, volatility regimes, and risk tolerances can produce very different outcomes.
Fibonomy’s current money-management rule uses a specific operational threshold: the combined potential loss of active positions is compared with 2% of total account equity.
That is a Fibonomy product rule—not a universal law of trading.
The important part is the system behind it:
Each active position
      ↓
Identify risk boundary
      ↓
Estimate potential loss
      ↓
Add account-wide exposure
      ↓
Compare with account equity
If a valid stop exists, that is the primary risk basis.
If there is no valid stop, liquidation may be used as a fallback where it can be established reliably.
If neither provides a reliable boundary, the risk should not quietly become zero.
It should remain visibly unresolved.
Why Total Risk Can Change Without Opening a New Position
Account-wide risk is dynamic. Funding payments can change equity even when you open no new trade; see Can Funding Fees Move Your Liquidation Price?.
Suppose:
09:00

BTC risk      $200
ETH risk      $100
SOL risk       $60

Total         $360
Later, you move the BTC stop farther away.
Nothing was added to the position. If you do size up instead of moving the stop, that is a different change — see What Happens to Liquidation Risk When You Add to a Futures Position?.
But:
BTC risk

$200
 ↓
$340
Now:
Total Account Risk

$500
Or perhaps you partially close ETH:
ETH risk

$100
 ↓
$45
The total changes again.
This is why capital at risk is not a static attribute of a trade.
It changes when:
- position size changes,
- a stop is moved,
- a position is reduced,
- another position is added,
- account equity changes,
- or the fallback liquidation state changes.
The useful question is therefore not just:
“What was my risk when I entered?”
It is:
“What is my account exposed to now?”
Correlated Positions Make the Total More Important
Suppose all three positions are long:
BTC Long
ETH Long
SOL Long
Each position may individually have a reasonable stop.
But a broad crypto selloff can move all three toward those stops at the same time.
That is why aggregate risk matters.
A trader can respect an individual position-risk rule while still accumulating a much larger combined account exposure.
This idea is often described in trading literature as portfolio heat: the sum of open trade risk across the account.
The exact terminology matters less than the question:
If several open positions fail together, what does that do to the account?
What to Check Across Your Open Positions
If you want a clearer account-risk picture, check these in order.
1. Current account equity
The denominator matters.
A $400 potential loss means something very different in a $5,000 account and a $100,000 account.
2. Position size
You need the actual current position, not only the original entry size.
3. A valid protective boundary
Is there currently a stop?
Does it cover the full position?
Has the position changed since the stop was placed?
4. Potential loss to that boundary
Calculate the downside using the appropriate contract mechanics.
USDT-margined linear contracts and inverse contracts should not be assumed to use identical calculations.
5. Positions without a valid stop
Do not silently omit them.
6. Margin mode
Is the position isolated, cross margin, or portfolio margin?
That changes how liquidation should be interpreted.
7. Total account-wide risk
Only after each position has been evaluated should the numbers be aggregated.
Four Numbers. Four Different Questions.
This is the simplest way to remember the distinction.
POSITION SIZE
How much exposure do I have?
MARGIN
How much collateral supports it?
P&L
Where is the position right now?
CAPITAL AT RISK
What could this account lose
at its current risk boundaries?
If your trading screen only makes the first three obvious, you are still missing part of the account story.
The Bottom Line
The clearest way to understand risk across open futures positions is to evaluate each position’s potential loss and then compare the combined amount with account equity.
Knowing that you have $25,000 of open futures positions does not tell you that $25,000 is at risk.
Knowing that $4,000 of margin is in use does not mean $4,000 is at risk.
And seeing a current unrealized loss does not tell you the potential loss at your planned exits.
To understand how much of your account is actually at risk, you need to reconstruct the downside of each open position and then view those losses together against account equity.
When every position has a valid protective boundary, that calculation can be relatively clean.
When a position does not, the honest answer becomes more complicated.
And sometimes the most important risk signal is not another percentage.
It is:
“We cannot establish a reliable boundary for this position yet.”
See How Much of Your Account Is Actually at Risk
Fibonomy brings your active positions together, evaluates their current risk basis, and shows how much potential loss they represent relative to your account equity.
This content is for educational purposes only and does not constitute financial, investment, or trading advice. Stop-loss execution is not guaranteed, and actual losses can differ because of market conditions, slippage, liquidity, fees, exchange rules, margin mode, and other factors.
FAQ
How do you measure risk across open futures positions?
Estimate each position’s potential loss to its current protective exit, add those amounts, and divide by account equity.
Is position size the same as capital at risk?
No. Position size is market exposure. Capital at risk is the planned loss if the protective boundary is reached.
Is margin the same as capital at risk?
No. Margin is collateral allocated to support leveraged exposure. It is not the loss you have planned to accept.
What if a position has no stop loss?
Planned risk cannot be fully established. Liquidation may be used as a fallback boundary, but it is an exchange control event, not the trader’s planned exit.
Why can total account risk change without opening a new position?
Moving a stop, reducing a position, changing equity, or a shifting liquidation fallback all change combined capital at risk.
Sources
Bybit — Trading Rules: Liquidation Process (Unified Trading Account)
Cross-margin account-level risk, shared margin, Account IMR/MMR, and liquidation mechanics.
Bybit — Differences Between the Margin Modes Under the Unified Trading Account
Differences between isolated, cross, and portfolio margin and the meaning of estimated liquidation prices.
OKX — How Does Liquidation Work in Futures Trading?
Relationship between TP/SL, maintenance-margin conditions, and forced liquidation.
OKX — Why Didn’t the TP/SL Execute at the Set Price?
Trigger types, market volatility, order-book depth, partial fills, and non-execution risk.
OKX — Terms of Service: Stop Loss and Margin Risk
Stop-order execution risk and the distinction between margin requirements and total contract value.